


Trend Short: 4 Tokens vs 10 Tokens
Token expansion analysis for SOVEREIGN Trend Short.
Capacity Rationale
Note: For clearer visualization due to larger differences, this directive showcases the AA Trend Short versions.
The biggest reason for the token expansion is the capacity of the strategy. It is no secret that the 4-token Trend Short experienced multiple trades with excessive slippage, making the final outcomes worse than they should have been.
Following October 10/11, liquidity has decreased across the tokens, and most of the new liquidity is concentrating mainly in the larger tokens.
Full-Period Comparison
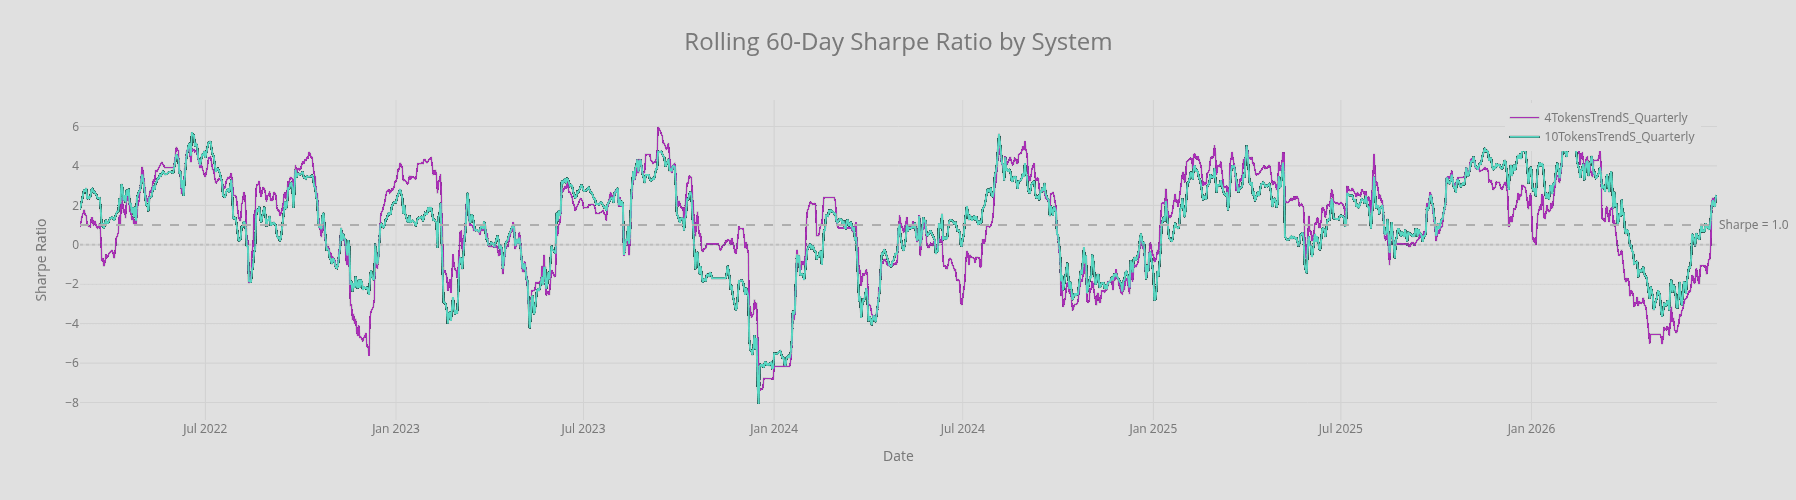
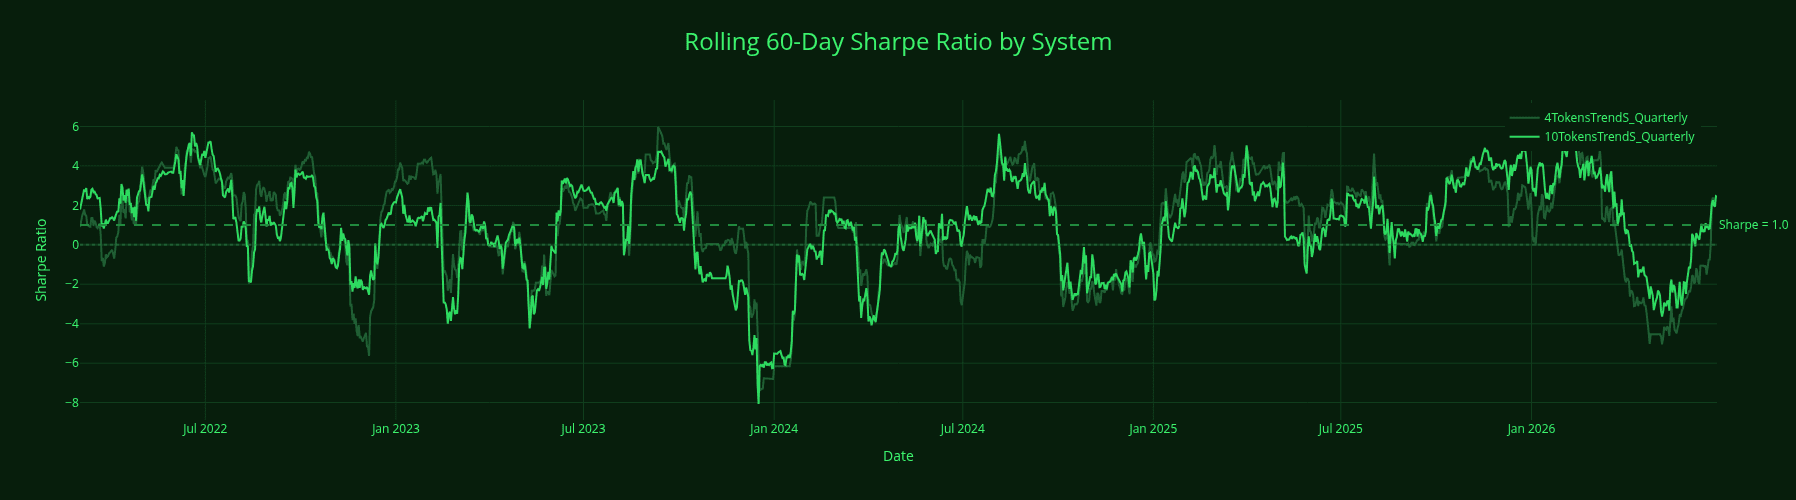
Looking over the full data, both the 4-token and 10-token versions look effectively the same. The 10-token version shows a lower outcome here, although we have to treat that with some uncertainty around the actual October 10/11 execution outcomes. More on that further down.
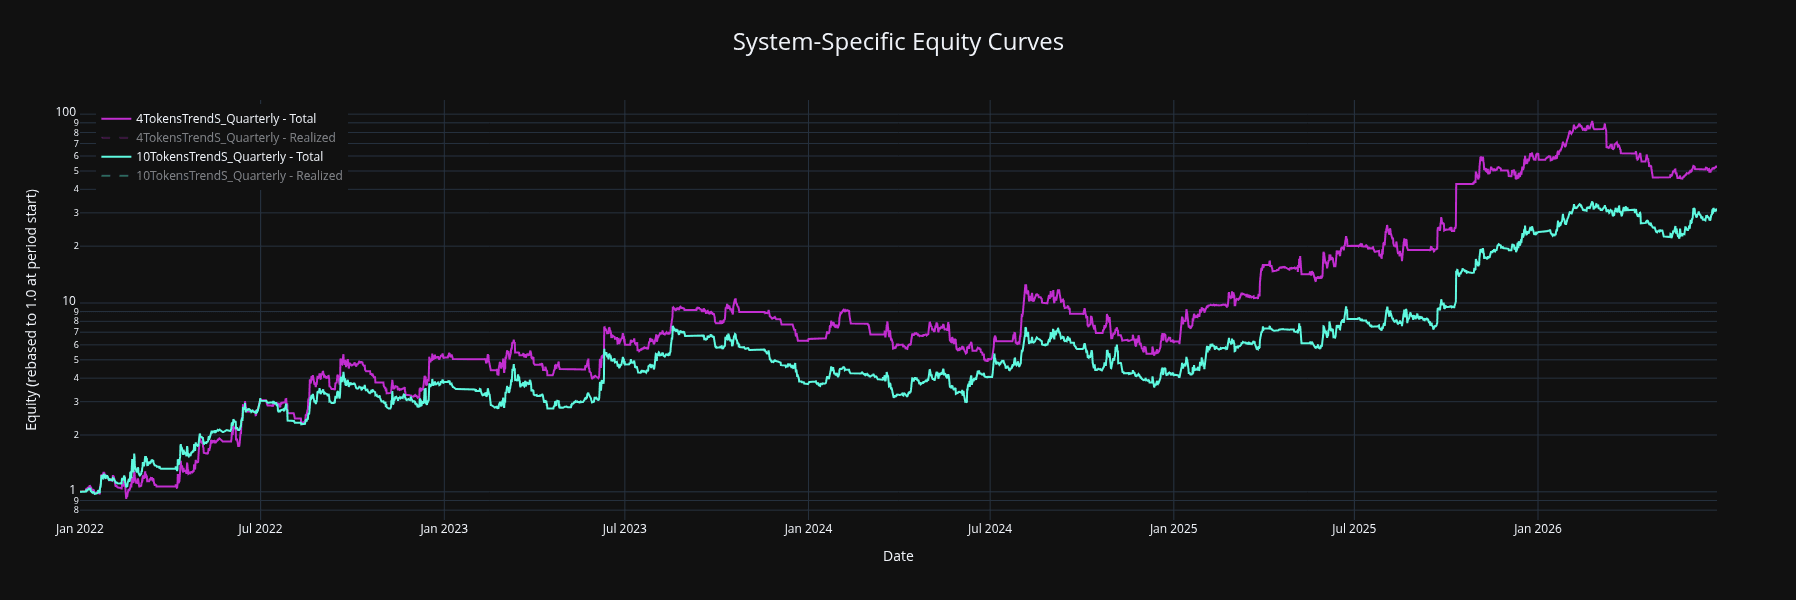
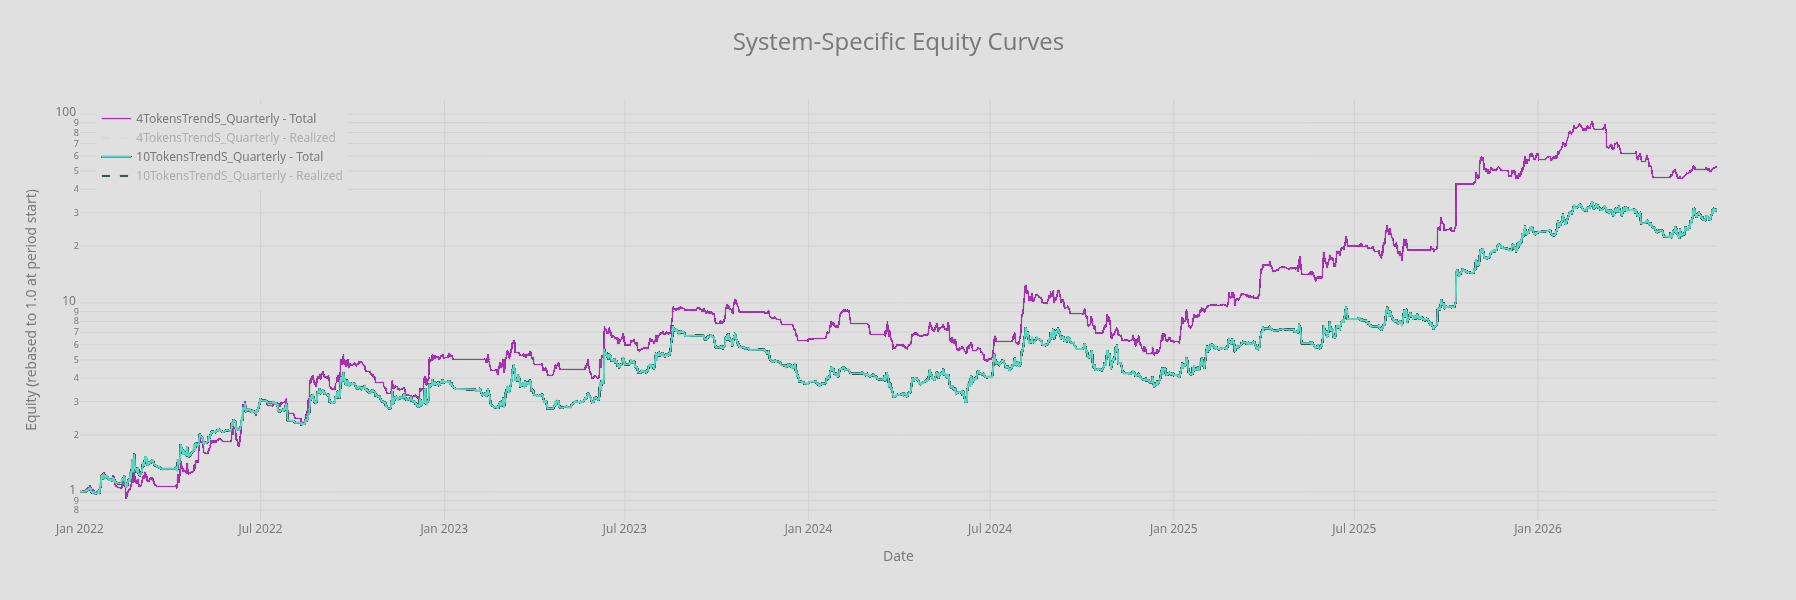
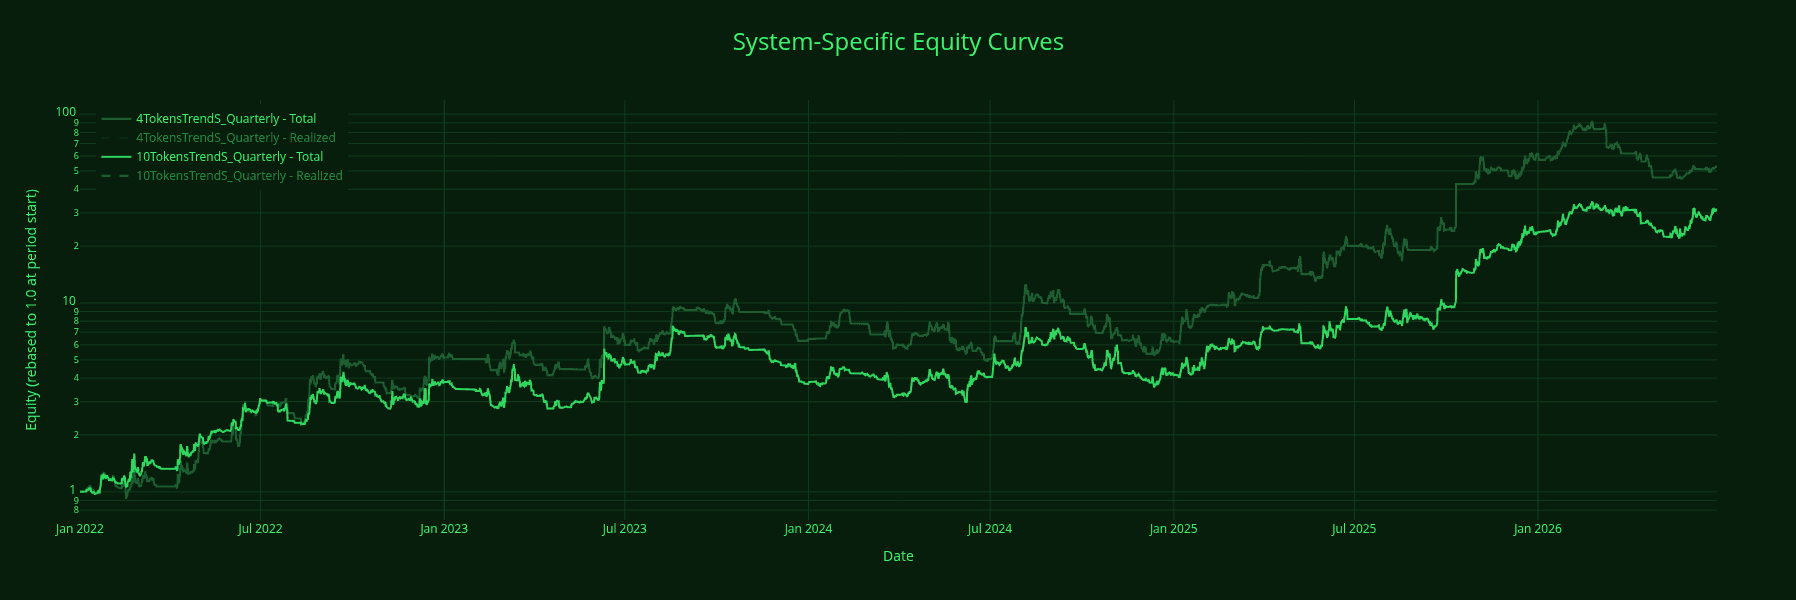
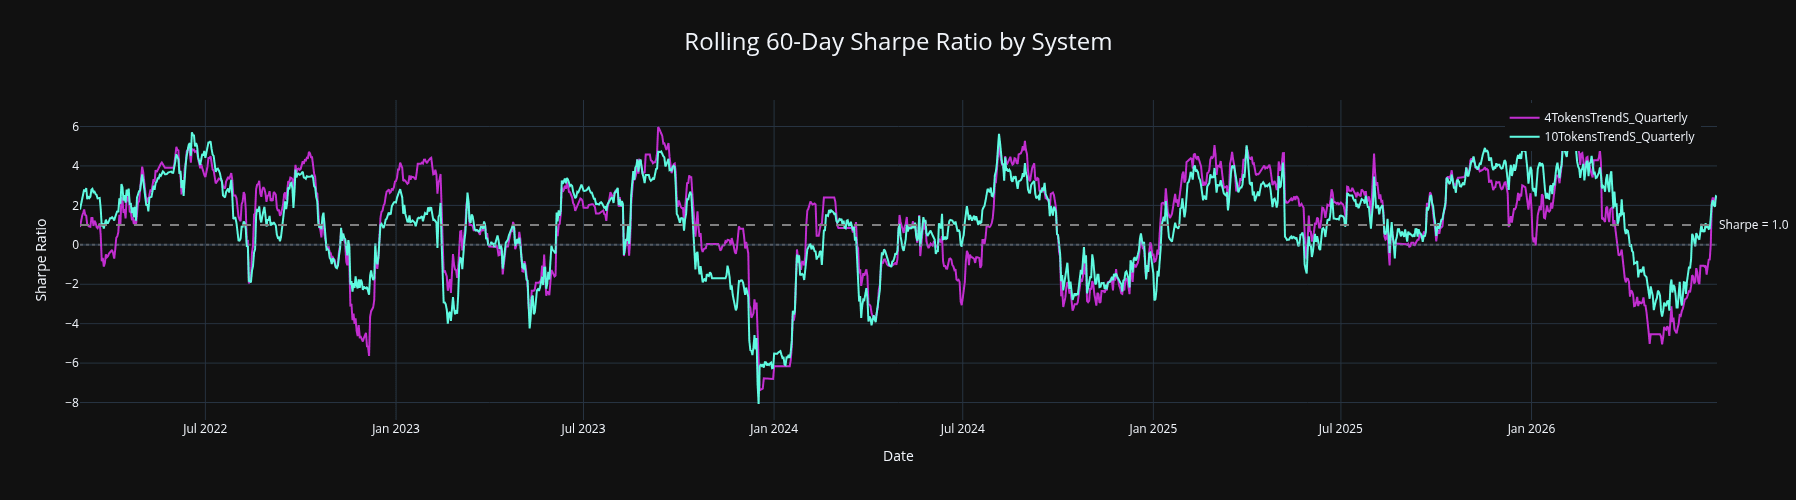
Looking at, for example, a shorter-lookback rolling Sharpe ratio confirms the same observation: the behavior is consistent.
Volatility Expression
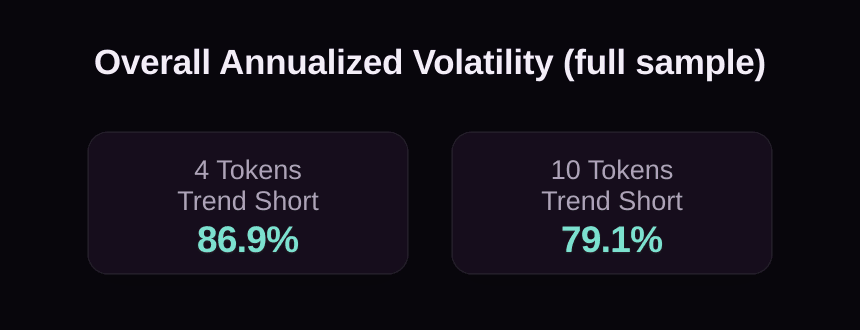
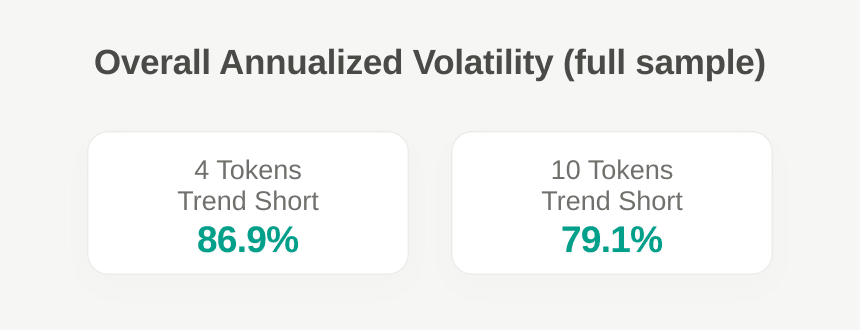
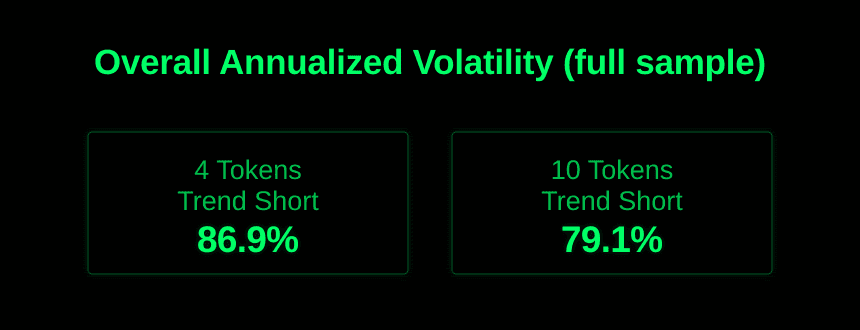
Because it is trading more and different tokens, the behavior will be similar but not the same. We can see that in the annualized volatility below, where both showcase roughly similar volatility but the precise expression of the volatility differs.
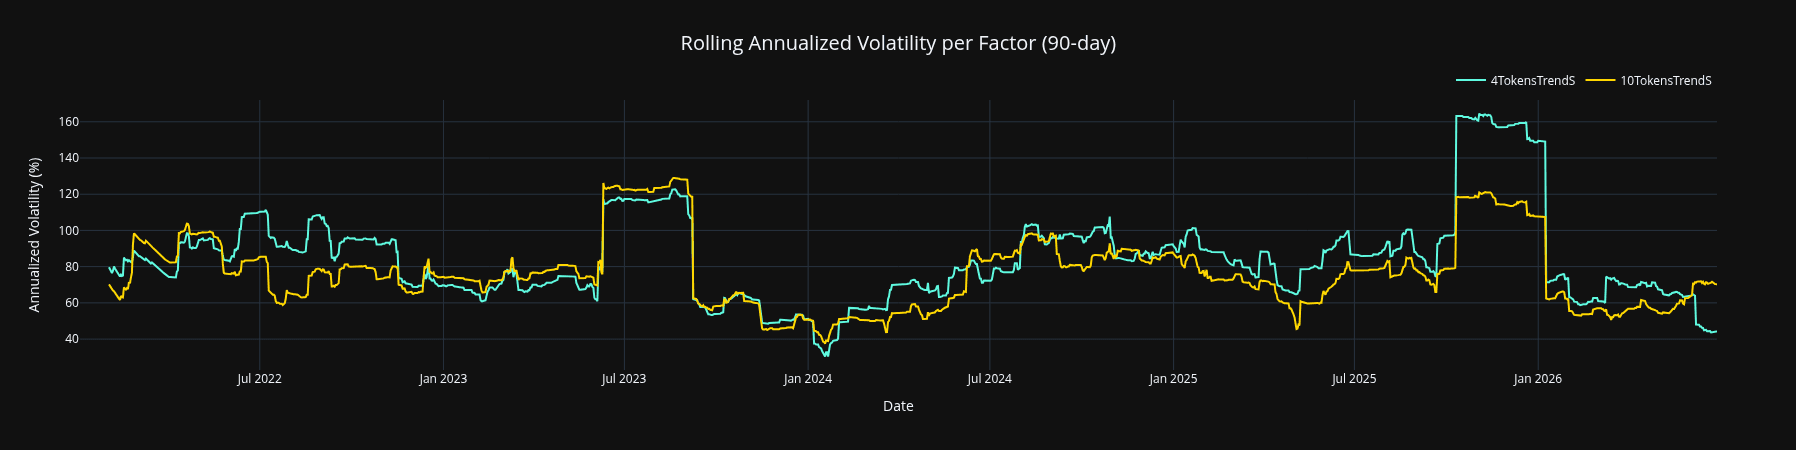
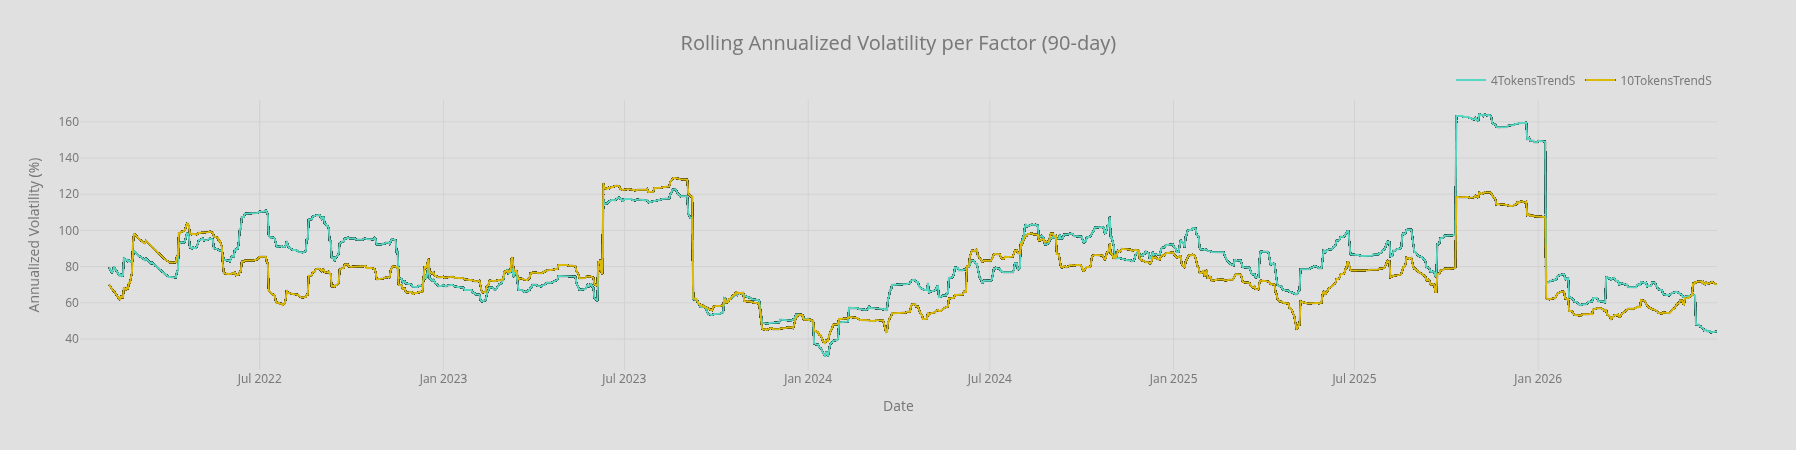
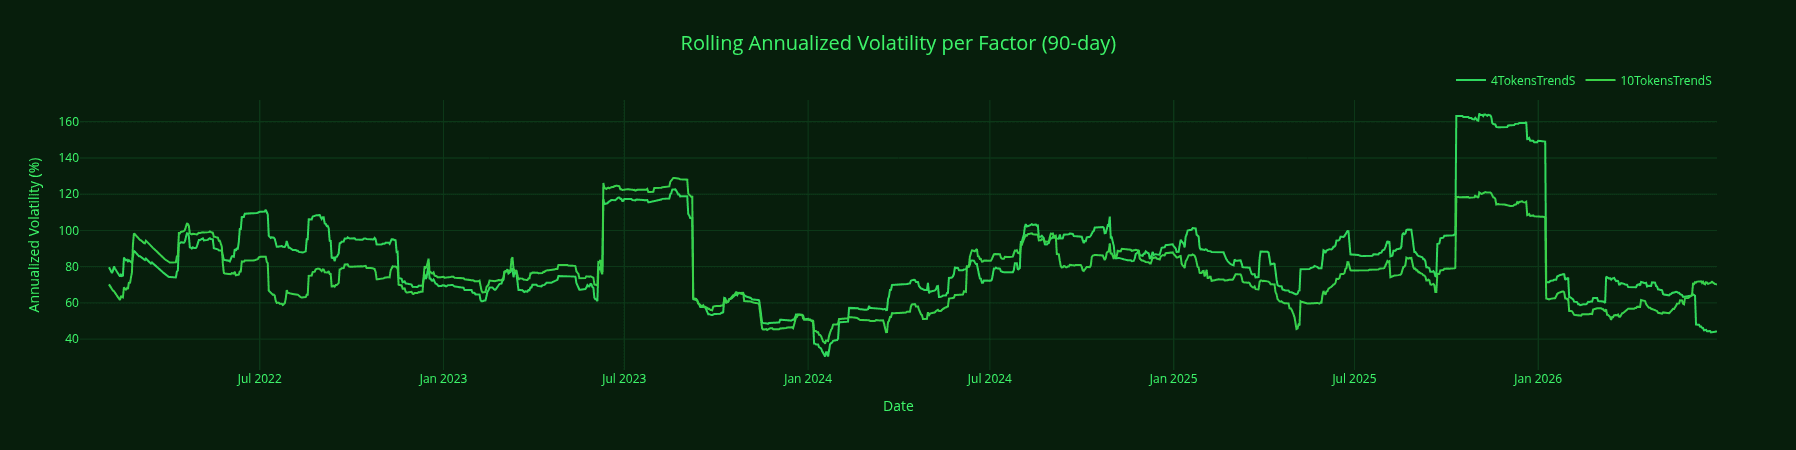
More tokens means less capital allocation to any individual token and therefore less impact on the strategy via any single trade. This leads to slightly lower volatility on the 10-token composition.
Yearly Path Differences
This difference also shows when comparing the yearly behavior of both compositions:
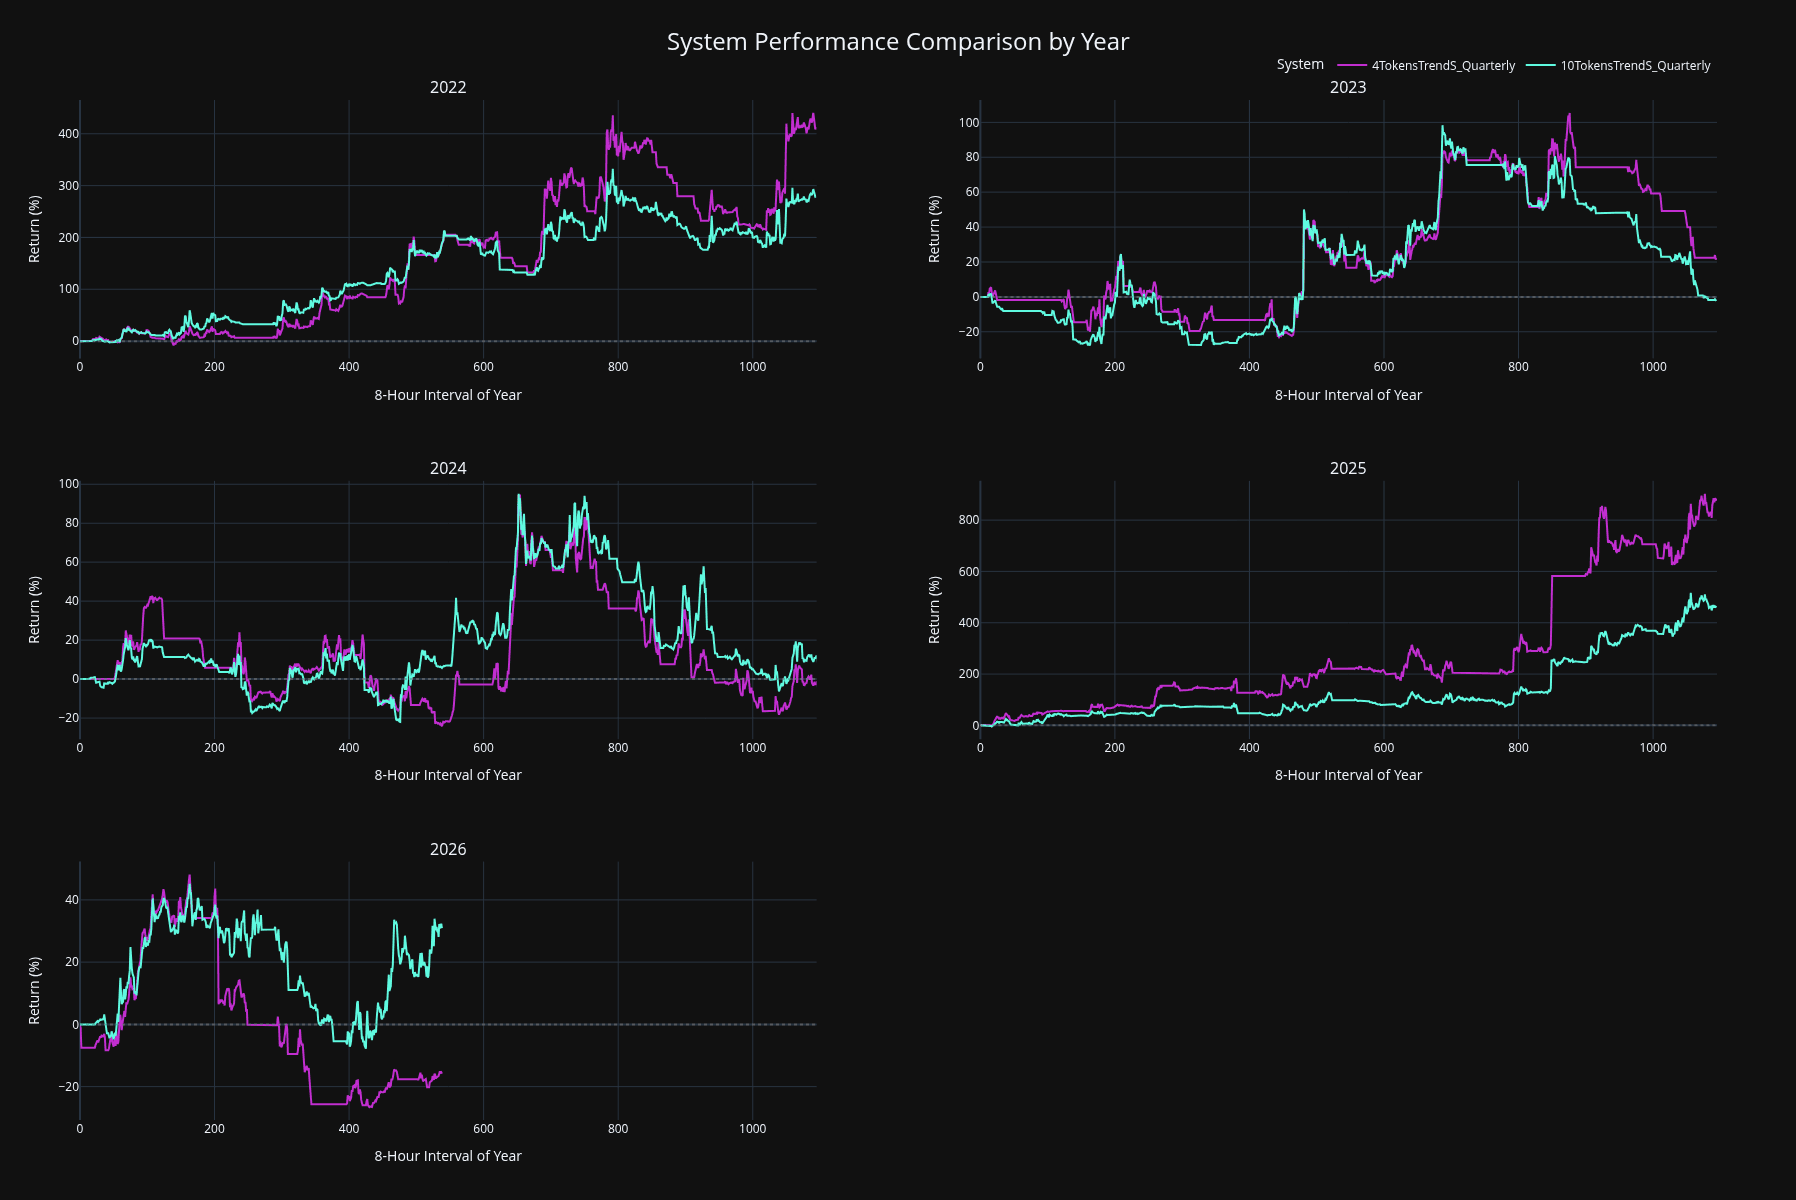
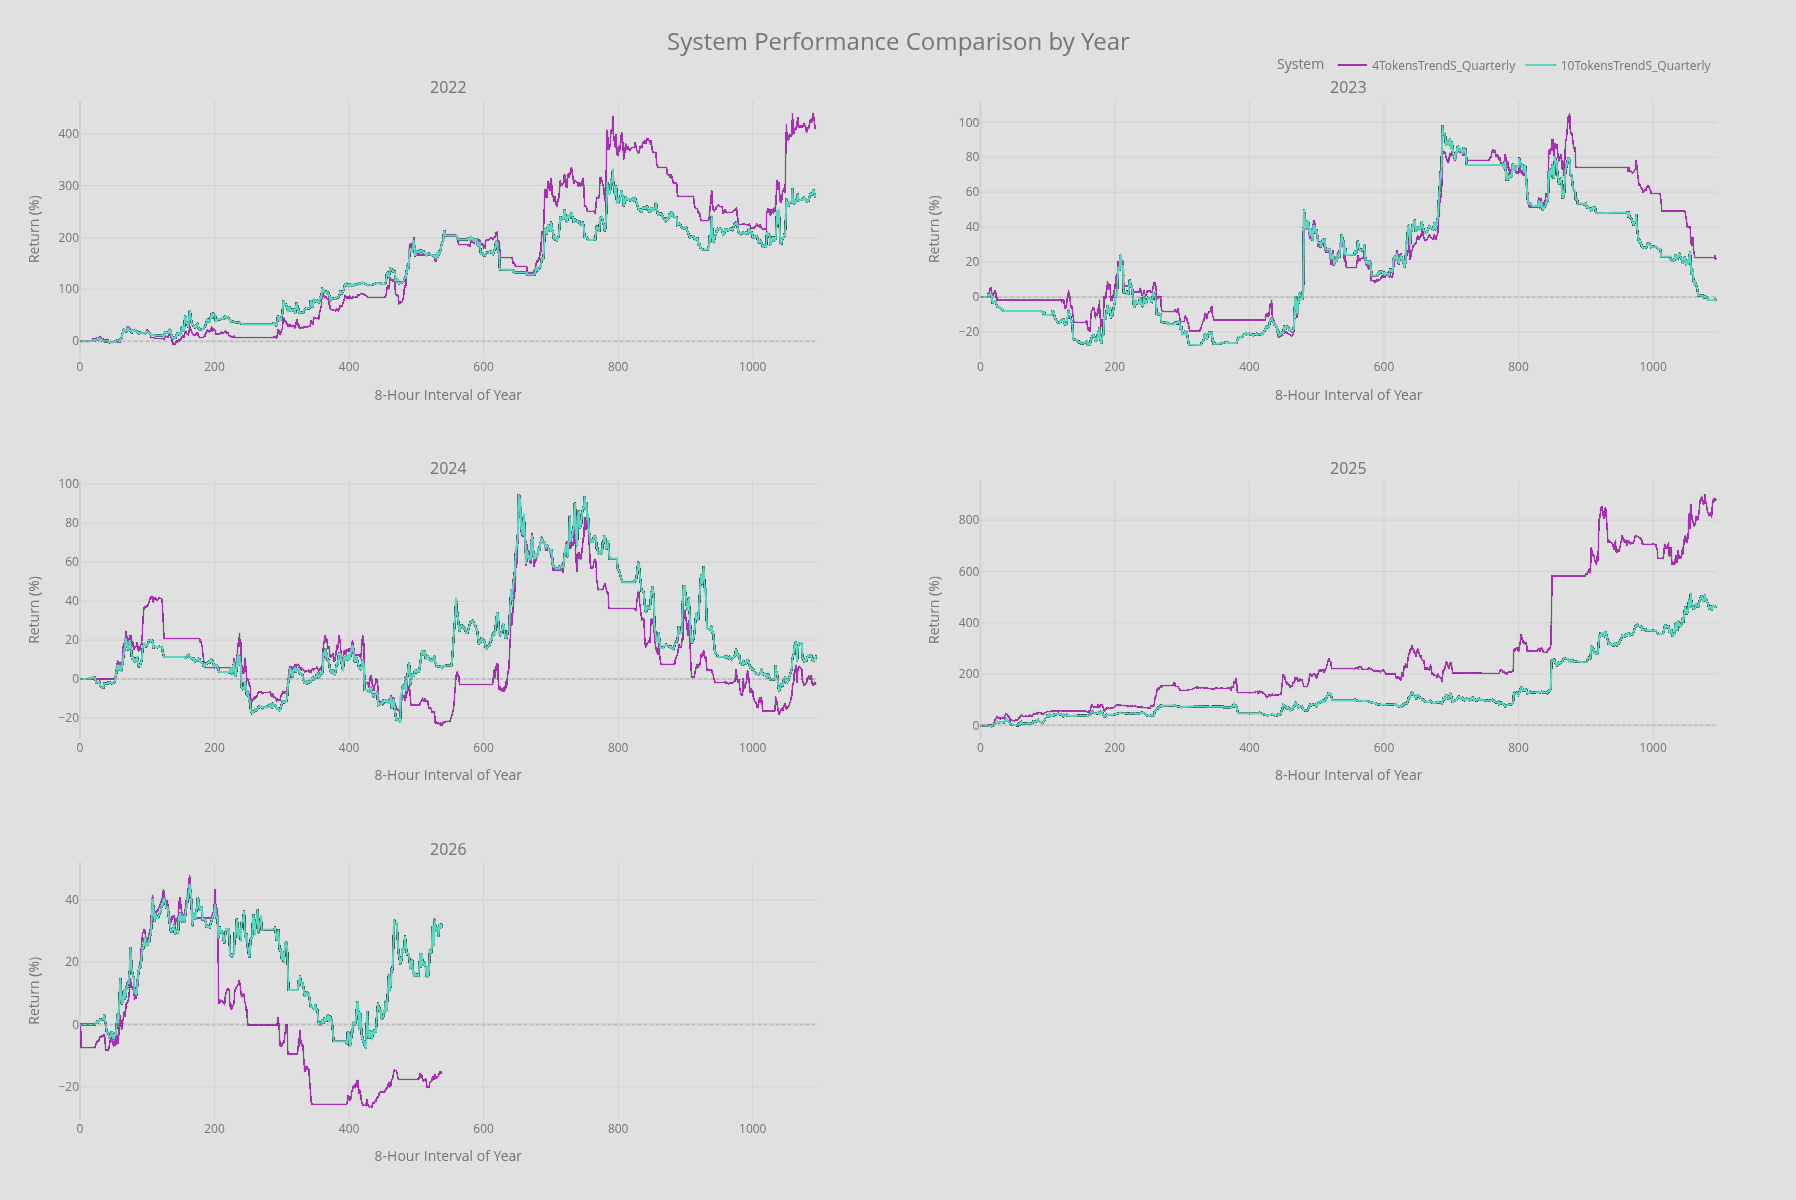
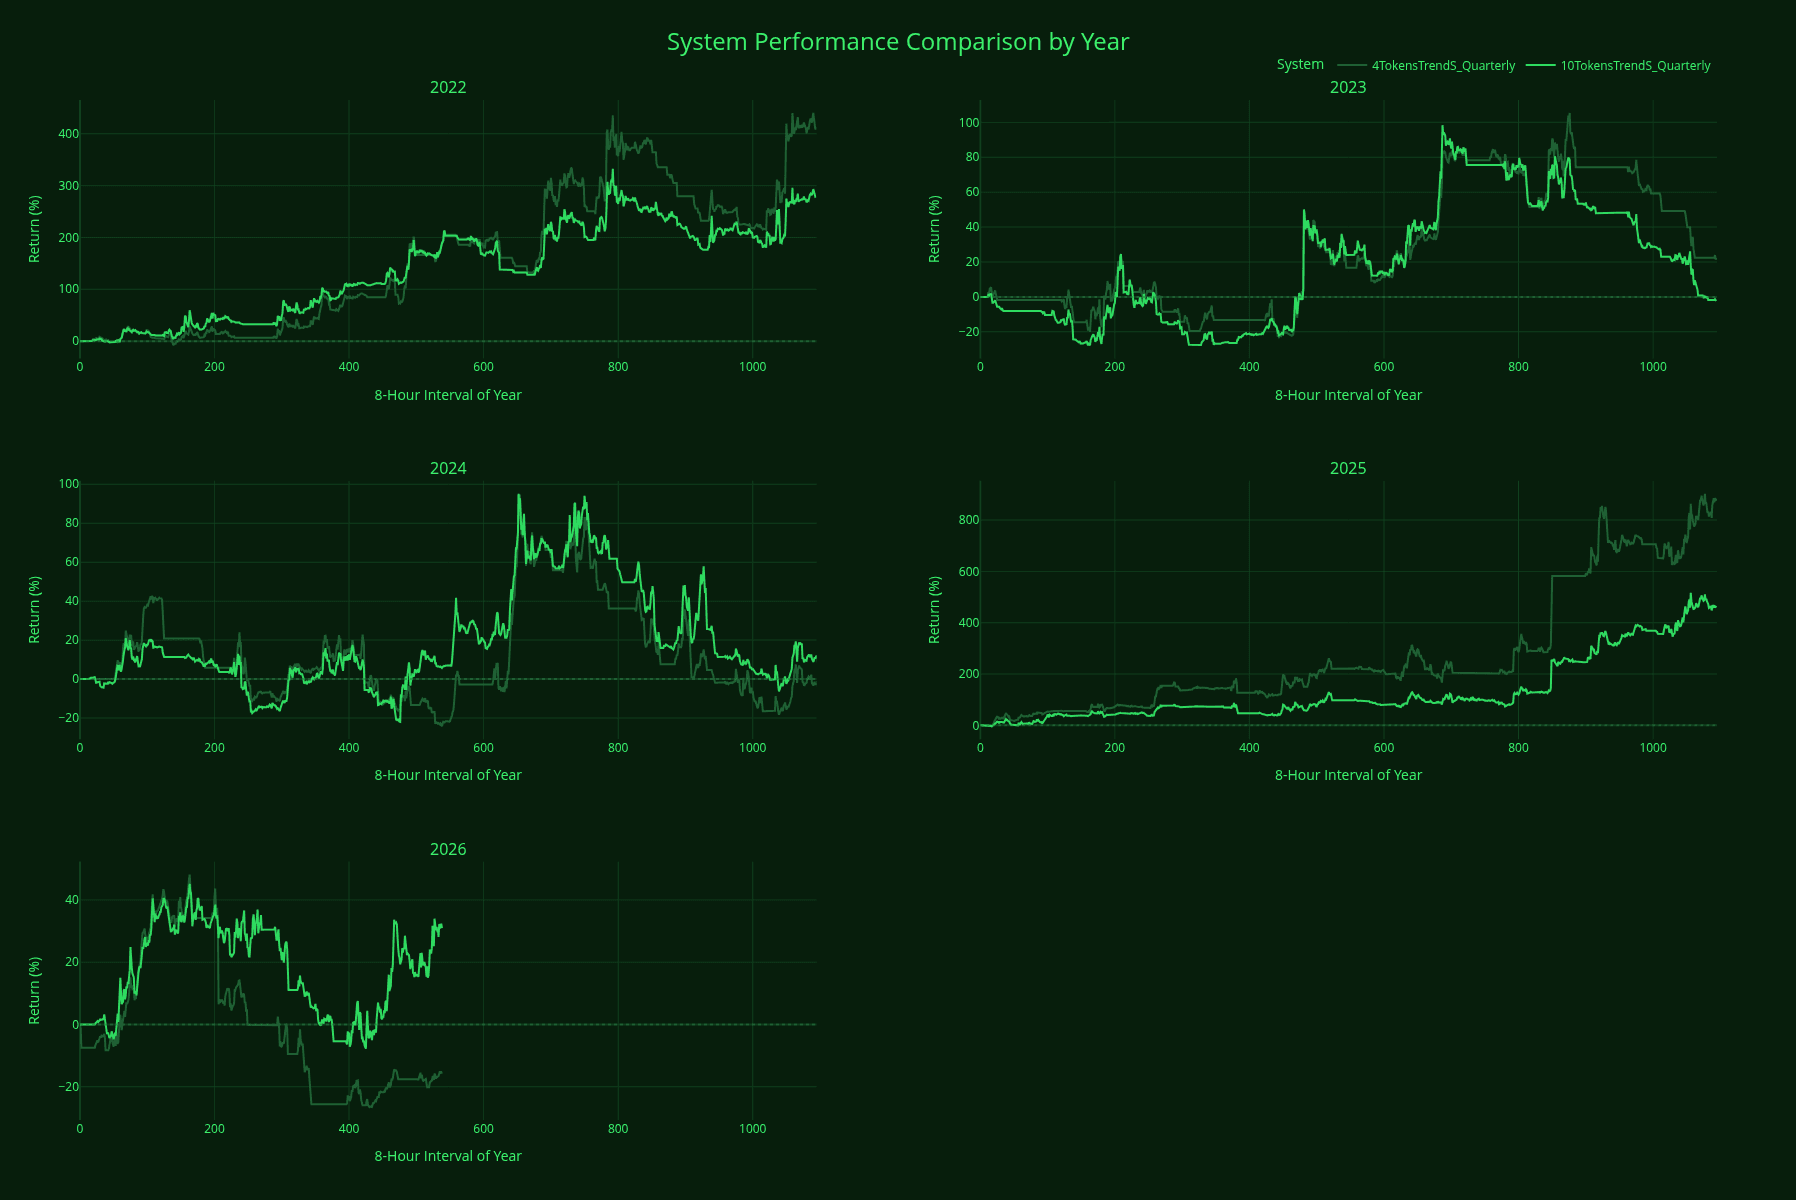
We can see that while they tend to move together, there will be differences in path and final outcome.
Two things likely come to attention here:
October 10/11
The widening behavioral/equity spread in 2026
October 10/11
For the 4-token Trend Short, two tokens were allocated at the time (ETHFI, PENDLE) and received ADL-favored better exits.
The 10-token configuration also had ETHFI and PENDLE positions, and the data was adjusted to match the same exit prices as in the 4-token Trend Short. However, the 10-token Trend Short also had three other active positions whose trades were not adjusted, because the actual ADL prices are unknown.
The likely result is either the same relative outcome as the 4-token configuration or better. This is not reflected in this comparison.
Widening Spread in 2026
This is mostly driven by liquidity issues in the 4-token variant, where some adverse execution significantly impacted terminal outcomes.
This is the important focus of this token expansion.
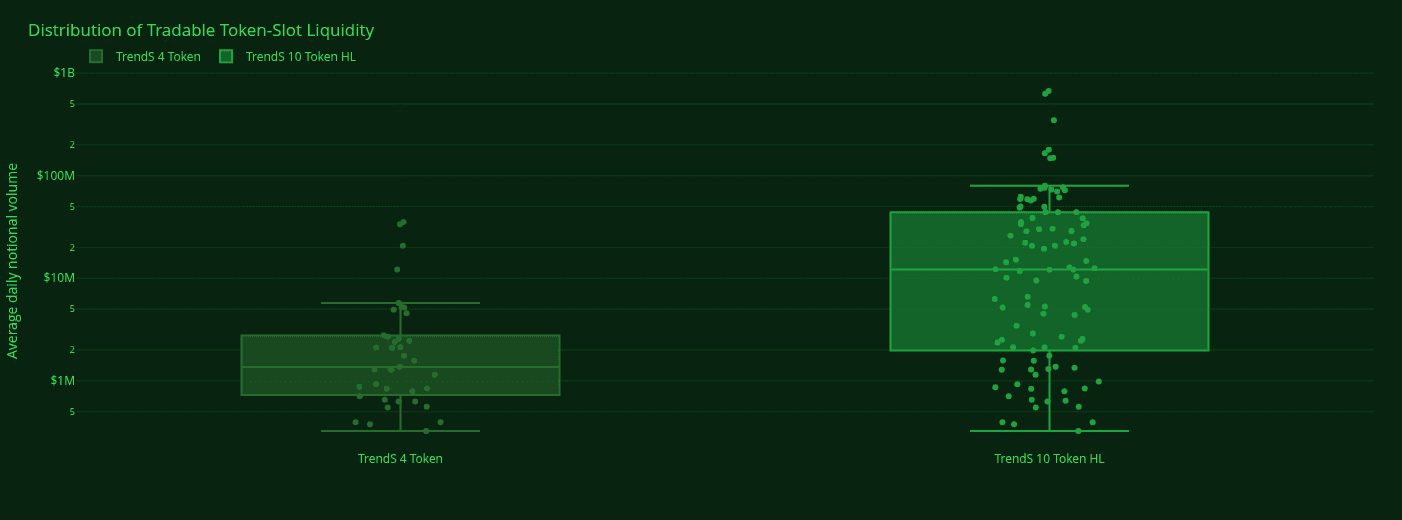
The following is a decent mental proxy to think about the difference:
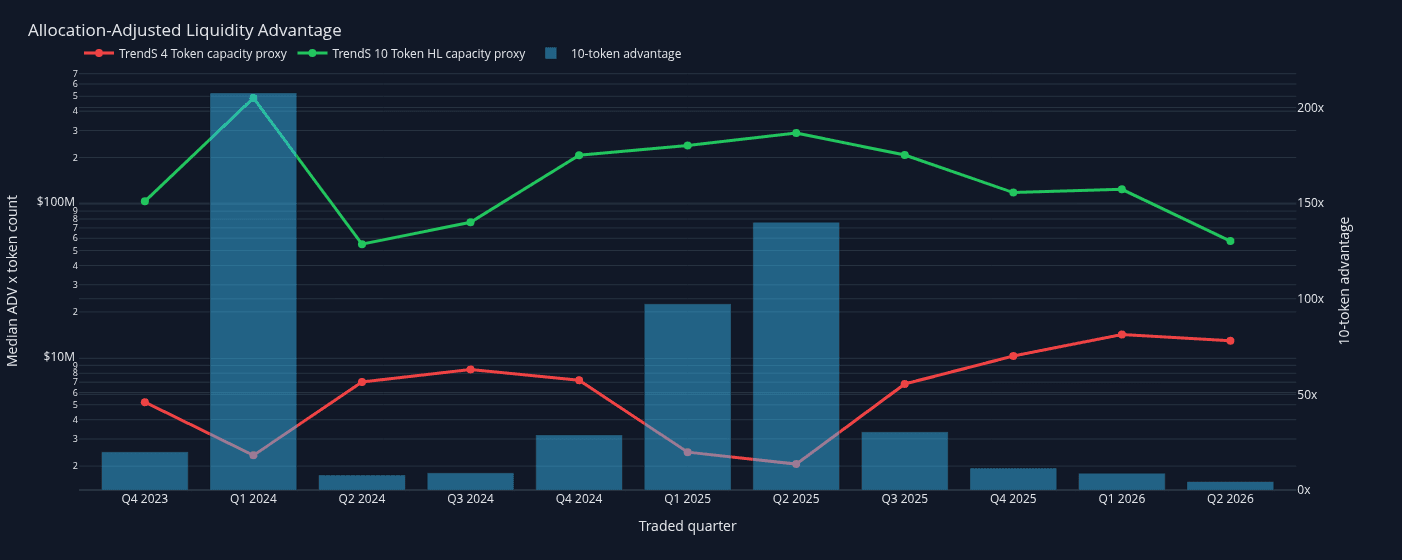
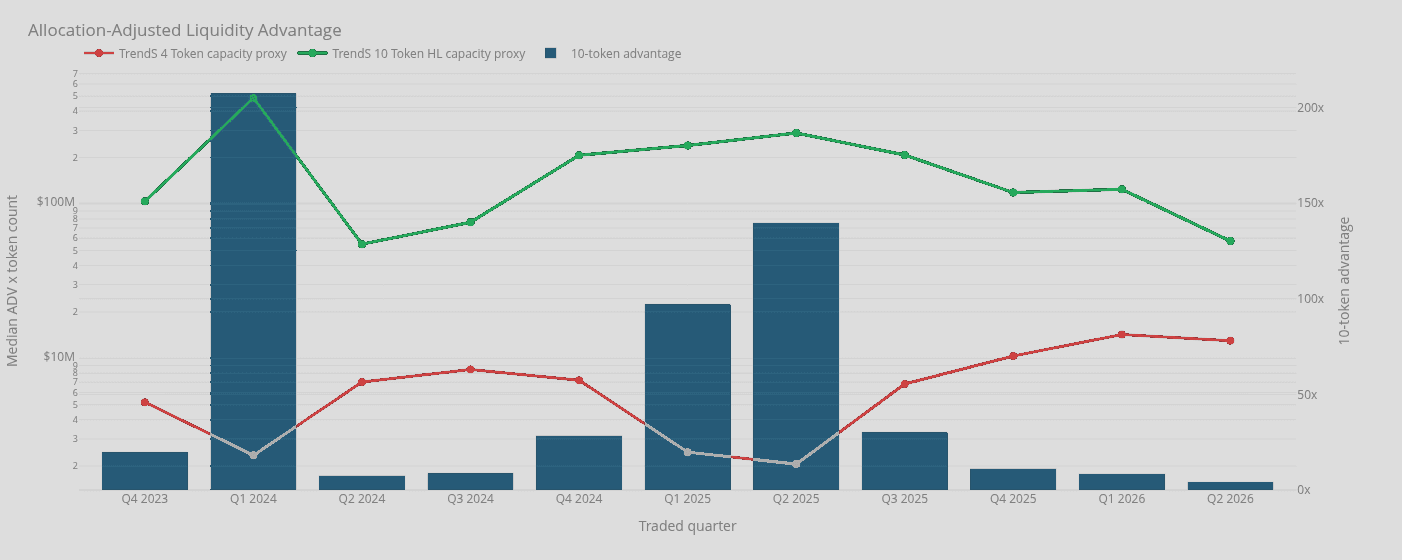
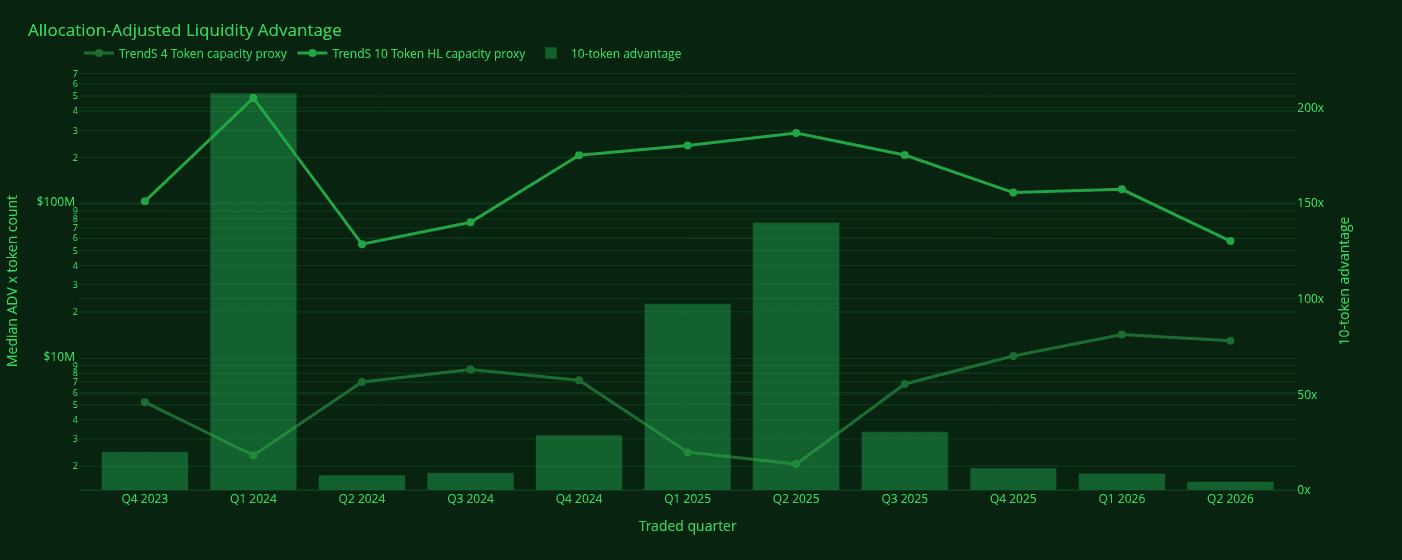
It is also flawed in that it looks at median/combined token liquidity within each quarterly selection, rather than the smaller-token liquidity that would be the limiter here.
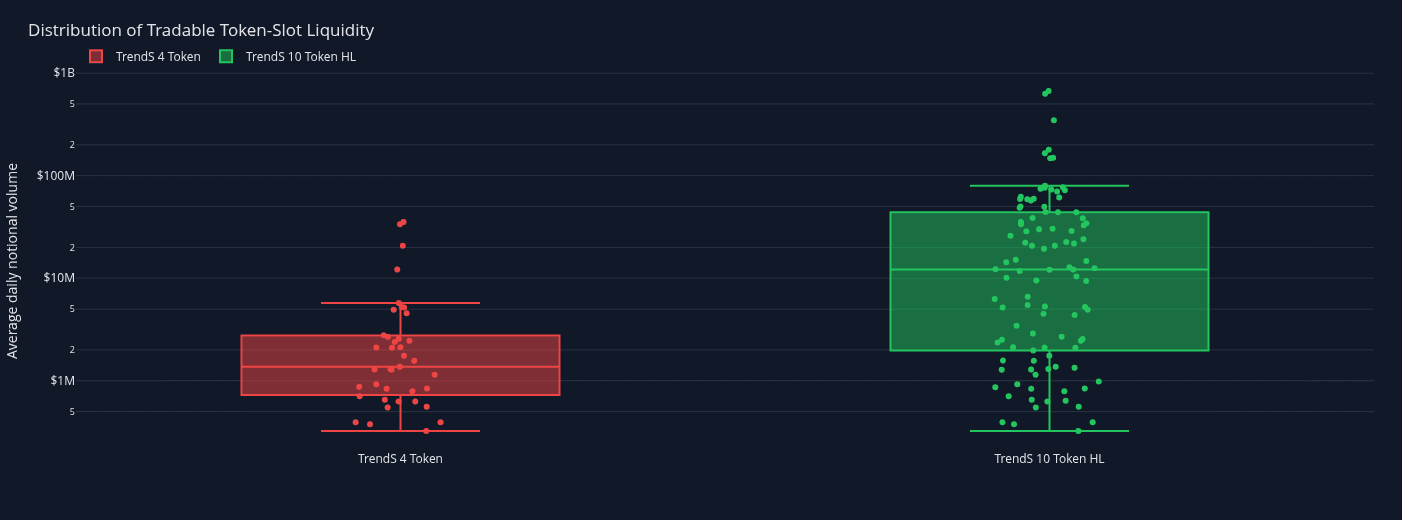
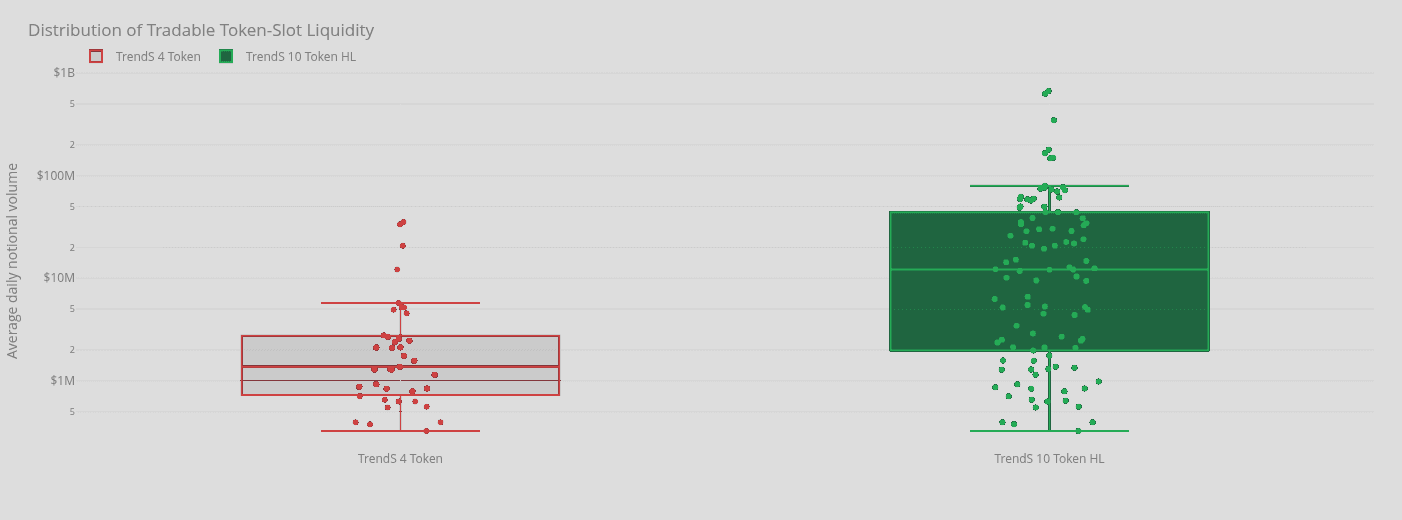
Liquidity Scaling
Both visuals look great and bring home the point in expected liquidity difference but miss an important market behavior: in the market, you usually do not get linear scaling. Many things scale closer to log, cube root, square root, etc. after a certain point. Not linearly. That applies to liquidity, orders, order-book depth, price impact, slippage, etc.
By going from 4 tokens to 10 tokens, position size on the four lower-liquidity tokens is reduced by 60%. This means the system is now consuming 60% less of each individual token's order book, which does scale linearly while operating inside that token's liquidity pockets. Meaning adverse slippage effects will reach approximately 40% of previous severity.
At the same time, because size is reduced, the frequency of hitting cascade walls—consuming all order-book liquidity at the nearest price—also drops exponentially.
Excess Loss Scaling
If we look at a hypothetical event of an extreme excess loss due to, for example, a liquidity cascade, the math is as follows:
100% size = 100% bad excess loss
50% size = ~35% excess loss
40% size = ~25% excess loss
The total dollar cost—or here, excess loss—scales by Size^1.5 (the 3/2 power rule). That is why reducing size by 1.5x reduces adverse effects by ~3x.
Due to how sizing behaves, the difference is also most extreme in Aggressive Alpha, because positions have a larger size difference. In Controlled Alpha, terminal-outcome differences are significantly smaller.
Software and engineering services. Not financial, tax, or investment advice.