

Directives
Dec 14, 2025
System: Mean Reversion
New subsystem for SOVEREIGN
by CelestialEye | Quantitative Systems Engineer
Understanding Mean Reversion (MR)
At its core, Mean Reversion exploits the tendency of markets to over-react.
The Setup MR systems look for price action that is statistically unsustainable. This includes movements that are:
Too rapid (Velocity).
Too extended (Magnitude).
Unsupported by sustainable volume.
The Execution Regardless of the news cycle or narrative driving the move, an MR system focuses purely on the deviation from fair value. It executes a counter-trend trade, betting on a return to equilibrium or a corrective snap-back.
The Risk/Reward Dynamic MR acts as a volatility risk premium. The trader is compensated for stepping in front of a moving market. The inherent risk, however, is that the price extension validates a new valuation level rather than reverting, leading to momentum losses.
The Risk Premium Cycle
Capital Flow Dynamics
Price Appreciates: MR Sells → Momentum Buys → Trend Buys.
Price Depreciates: Trend Sells → Momentum Sells → MR Buys (Capitulation).
Market Function: Buyer of Last Resort MR provides critical liquidity when other participants are forcing exits.
The Risk Profile
High Win Rate: Reverting oversold conditions is a high-probability setup.
Left Tail Risk: The "falling knife" scenario; if MR is wrong, drawdowns are sharp.
The Premia: Returns are the compensation for taking the contrarian side of panic.
Sustainability MR traders are paid to absorb the immediate liquidity demand of market participants exiting at distressed prices.
The Counter-Party Analysis: Who Sells to MR?
To understand the edge, we must identify the liquidity sources. MR traders acquire positions from four distinct groups during a decline.
1. Forced Liquidations (Structural)
Margin Calls: Leveraged longs undergoing liquidation.
Stop Cascades: Automatic stop-loss orders triggering sequentially.
Institutional Mandates: Risk managers executing VaR (Value at Risk) cuts or funds meeting redemption requests regardless of price.
2. Trend Followers (Systematic)
Reversal Signals: Technical breaks trigger automatic exit protocols.
Liquidity Provision: As the long-term trend breaks, these structural sellers supply volume to MR buyers.
3. Momentum Capitulation (Short-Term)
Velocity Shifts: Short-term traders dump positions as positive drift turns negative.
The Flip: Former aggressive buyers become aggressive sellers near the local low.
4. Behavioral Sellers (Psychological)
Retail Capitulation: Panic selling driven by loss aversion.
Emotional Exhaustion: Exits occurring when the psychological pain of the drawdown outweighs conviction.
The Edge and The Trap
The Liquidity Premium MR succeeds by deploying capital and patience when the market possesses neither. This structural edge creates a universal risk premium applicable across all timeframes, industries, and asset classes.
The "Fat Tail" Reality However, the strategy carries a specific fragility: MR works consistently until it fails catastrophically.
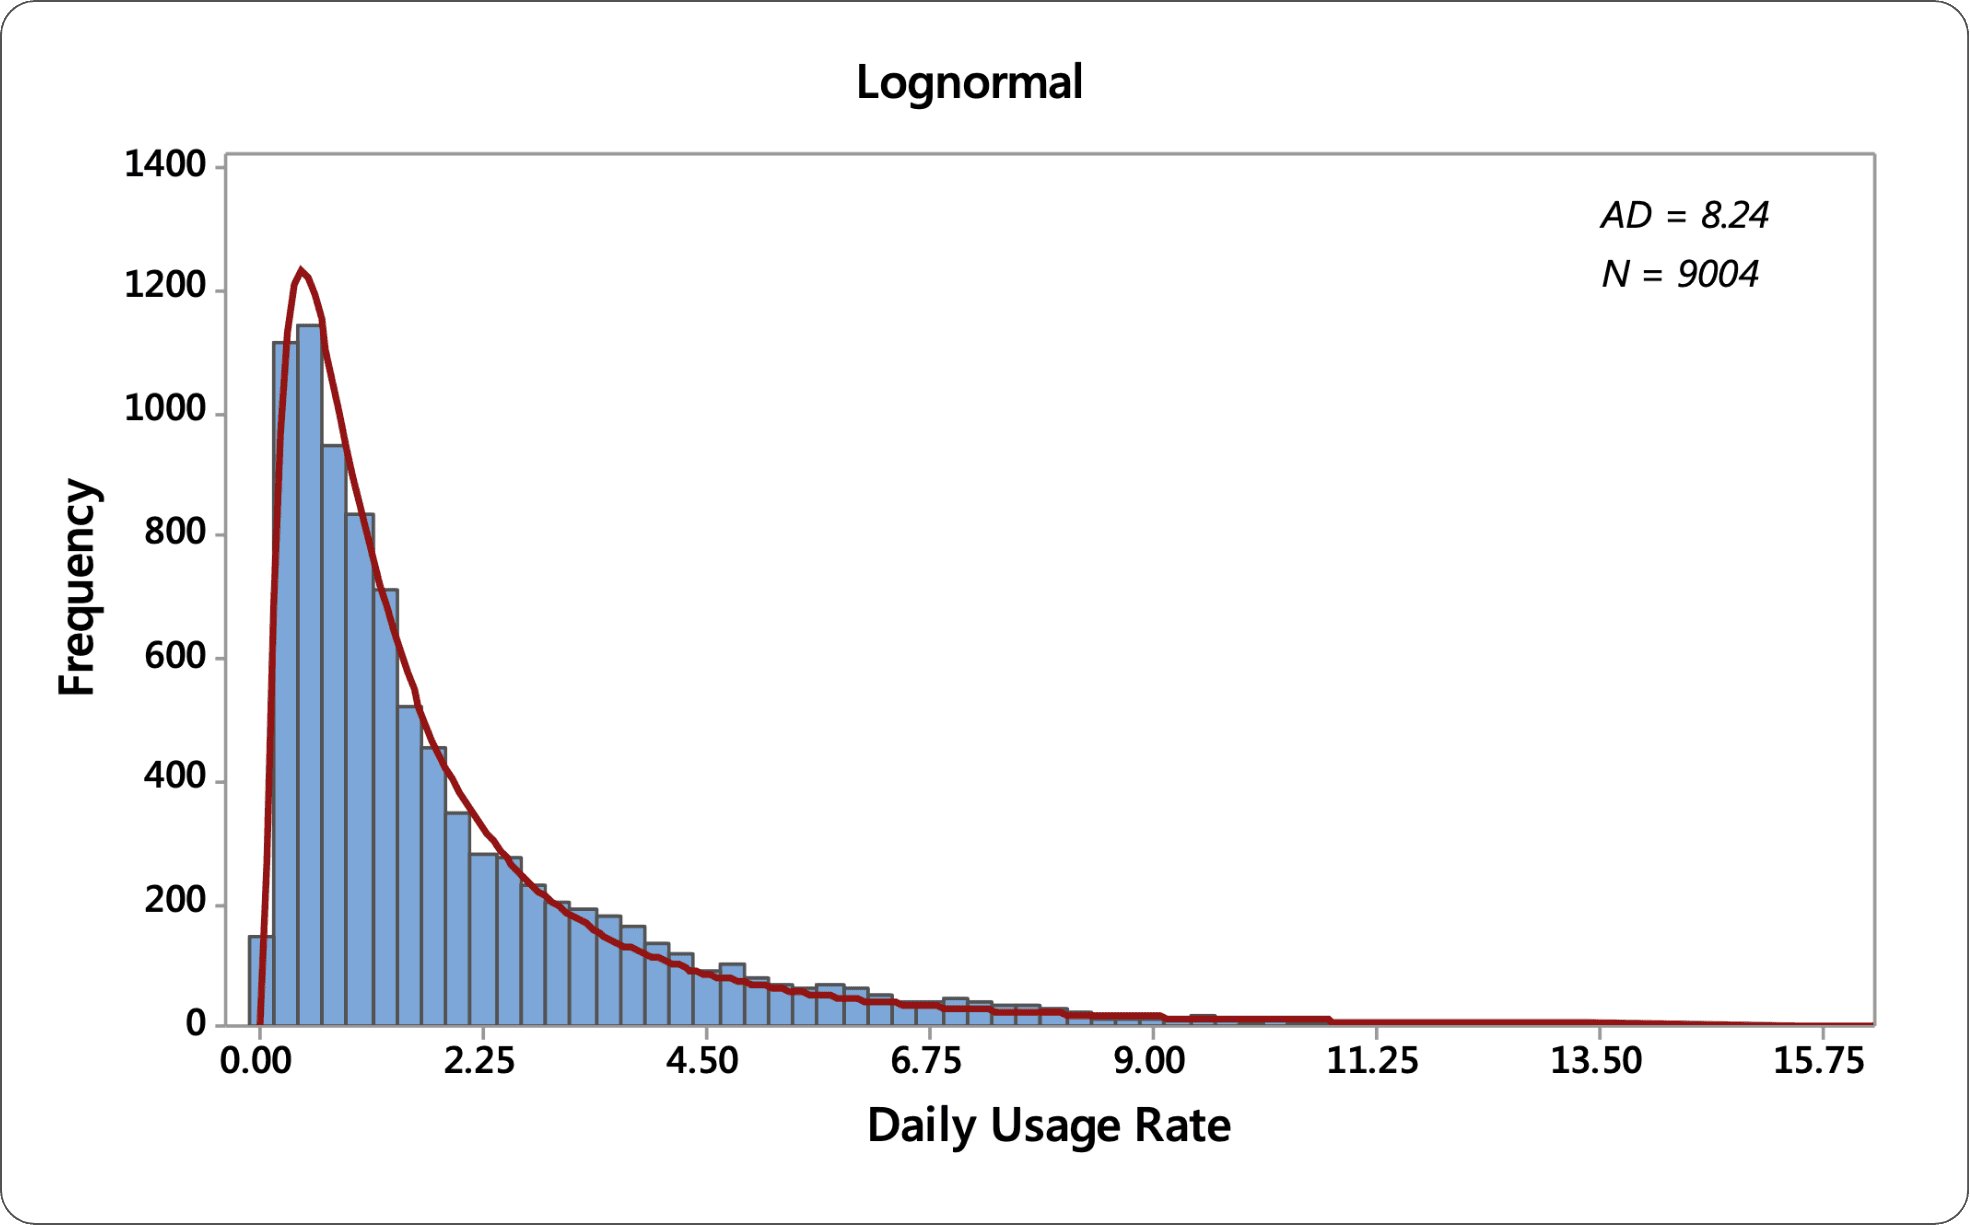
The Distribution Problem Standard models assume markets follow a Normal (Gaussian) distribution. In reality, markets exhibit "Fat Tails" (leptokurtosis) or log-normal characteristics.
The Assumption: Returns stay within standard statistical deviations.
The Reality: Extreme outliers (e.g., 1987, 2008, 2018, Covid) occur far more frequently than Gaussian models predict.
For the MR trader, these outliers are the primary threat. The risk is not that the model is slightly off, but that an extreme event renders the concept of "fair value" temporarily irrelevant.
The Distribution Trap: MR and Carry
The Systemic Vulnerability This dynamic is universal across all asset classes and timeframes. High win-rate strategies, specifically Mean Reversion and Carry, share a critical fragility: They are structurally dependent on the assumption of Normal (Gaussian) market behavior.
The Sigma Fallacy
Theory: A 3-sigma deviation is a statistical anomaly that demands a reversion to the mean.
Reality: Markets exhibit significant kurtosis ("fat tails"). Prices can expand to 10 or 20 standard deviations. In these moments, the market disregards our "normal" distribution entirely.
Strategy Divergence This tail behavior creates a binary outcome for market participants:
Trend Following / Momentum: This is their payoff phase. These strategies are designed to capture exactly these outlier events.
MR and Carry: This is the "kill zone." The assumption of reversion fails, leading to the infamous "steamroller" effect. This mechanism is the primary driver behind Basis (Carry) trade blow-ups.
Historical Precedents: Carry Trade Unwinds (Table)
Event | Assets | Description | Impact |
|---|---|---|---|
Russian Ruble Crisis & LTCM Collapse 1998 | RUB carry trades funded by low-rate borrowings; leveraged fixed-income arbitrage | Russia defaulted on debt amid oil price slump, causing capital flight and spread widening; LTCM's positions imploded. | Ruble devalued 70%; LTCM lost $4.6B, requiring Fed-orchestrated bailout; EM bond markets froze. |
Global Financial Crisis (Yen Carry Unwind) 2007-2008 | JPY borrowings invested in USD assets (e.g., subprime CDOs, AUD/NZD) | Credit crunch in Aug 2007 from yen funding withdrawal narrowed differentials; amplified by housing bubble burst. | Yen appreciated 25%; global stocks fell 50%; banking failures; $700B TARP bailout; recession. |
Icelandic Financial Crisis 2007-2008 | Borrowings in low-rate currencies (e.g., JPY) invested in ISK assets | Overreliance on foreign funding for high-yield krona; global credit freeze led to bank runs and krona collapse. | Krona fell 60%; banks nationalized; GDP contracted 10%; IMF bailout; export sectors hit hard. |
Eurozone Debt Crisis 2010-2012 | EUR peripheral bonds (Greece, Italy, Spain, Portugal, Ireland) funded by JPY or low-rate EUR | Debt sustainability fears and bailouts caused yield spikes; carry positions in high-yield bonds unwound. | Greek bonds impaired (haircuts up to 50%); euro weakened; stock markets volatile; ECB interventions like OMT. |
Taper Tantrum 2013 | EM currencies (e.g., TRY, ZAR, BRL, INR) funded by USD | Fed's QE taper signal triggered capital outflows; carry trades in high-yield EM assets reversed. | EM currencies fell 15-25%; bond yields surged; "Fragile Five" economies hit; short-term global volatility. |
Swiss Franc Unpegging 2015 | CHF-funded carry trades; bets on EUR/CHF peg at 1.20 | SNB abruptly scrapped peg amid QE pressures; franc soared, catching leveraged positions off-guard. | CHF rose 30% intraday; forex brokers bankrupt (e.g., Alpari); trader losses in billions; Swiss exports hurt. |
Yen Carry Trade Unwind 2024 | JPY borrowings invested in USD/MXN/NZD assets (e.g., stocks, bonds) | BoJ rate hike to 0.25% and US recession fears strengthened yen, eroding differentials and forcing sales. | Yen up 13%; global stocks (e.g., Nikkei -12% in a day); $250B+ unwound; tech sector hit hard. |
Mexican Peso Carry Trade Turbulence 2024 | MXN high-yield assets funded by low-rate currencies | Political reforms post-election raised concerns, narrowing rate gaps and triggering peso sell-off. | Peso fell 6%; amplified EM volatility; broader carry unwind effects. |
The "Turkey" Problem: Consistency vs. Catastrophe
The Stability Assumption Strategies like Carry and Market Making rely on a core assumption: that tomorrow will resemble today. In stable regimes, this generates a steady, smooth equity curve. However, this stability is often illusory. When market regimes shift drastically, these positions are often caught offside, leading to rapid capital destruction.
The "Short Volatility" Profile This is the inherent trade-off of high-win-rate, high-consistency systems. They effectively mimic a "Short Volatility" profile.
The Metaphor: In the industry, this is famously described as "picking up pennies in front of a steamroller."
The Risk: You collect consistent yield (pennies) for a long period, but risk a total wipeout (steamroller) during a tail event.
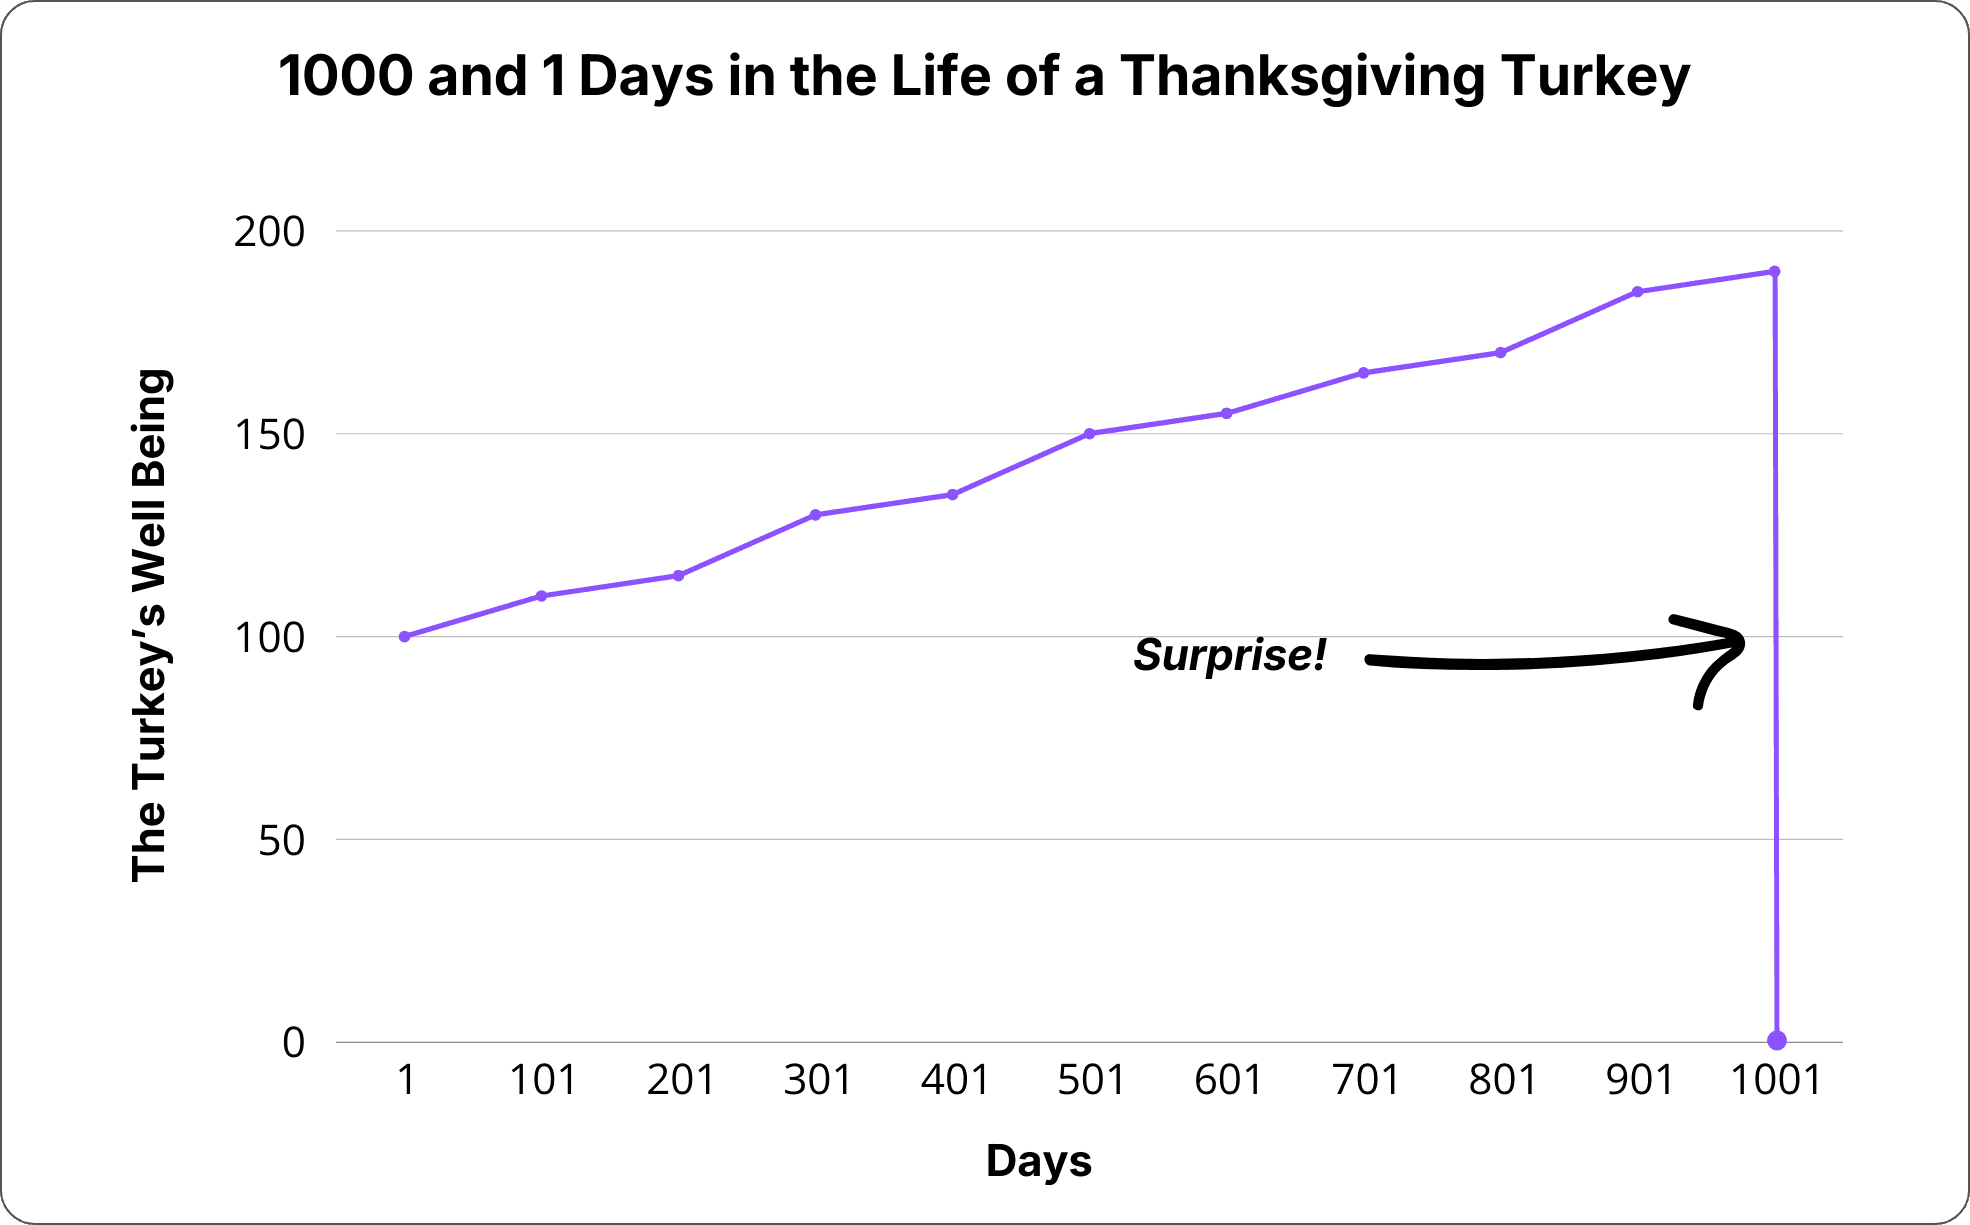
The Turkey Illustration Nassim Taleb's "Turkey" analogy perfectly visualizes this risk. The turkey experiences a high-consistency "win rate" (being fed daily) which reinforces its confidence in the system, right up until Thanksgiving day.
Why Trade It? Despite the tail risk, these strategies remain valuable because they generate consistent returns during periods of stagnation—times when Trend or Momentum strategies flatline. The key is in the implementation.
The Solution: Portfolio Integration To capture the yield while mitigating the "steamroller," these strategies must not be run in isolation.
Diversification: They must function as a component of a broader portfolio, not the totality of it.
Active Rebalancing: Frequent rebalancing (often after every trade) is required to bank profits and reset exposure before the inevitable regime shift.
The Mean Reversion Advantage While both Carry and MR share these risks, MR offers a distinct advantage. Unlike Carry, which is rigid, MR parameters can be tuned. By adjusting the system to accept a lower win rate or different entry thresholds, a trader can alter the return distribution, significantly reducing (although never strictly eliminating) the left tail risk.
The Latent Risk of Consistency
The Sharpe Ratio Illusion The existence of the left tail is the single most critical factor in system design. Traders are easily seduced by high-Sharpe, high-consistency equity curves. While these curves offer a sense of safety, they often mask - or more accurately, delay - the realization of risk!
The Insurance Paradox Estimating the true "Ruins Risk" of an MR system is notoriously difficult because the return profile mimics the insurance business model.
The Routine: Collect premiums (profits) consistently for long periods.
The Shock: Encounter a catastrophe of a scale never previously modeled, potentially leading to insolvency.
Operational Risk: MR vs. Carry To manage this, we must distinguish the mechanics:
Carry Strategy: Relies on continuous allocation and constant rebalancing. When correlations break (market stress), it becomes difficult to isolate and manage the downside risk of individual legs.
MR Strategy: Let's look at it in detail…:
Managing the Left Tail: Discrete Exposure & Circuit Breakers
Discrete vs. Continuous Exposure Unlike Carry strategies which require continuous market exposure, our Mean Reversion (MR) implementation is discrete. We utilize binary signals with a strict time horizon (maximum 1-day hold) to capture immediate over-reactions. This structure allows us to deploy precise risk tools that are unavailable to continuous systems:
Dynamic Position Sizing
Hard Stop-Losses
Independent Exit Algorithms
The "Circuit Breaker" Protocol The most significant risk to MR is a Regime Change, where a perceived "over-reaction" is actually a fundamental shift in value. To solve this, we apply a First Principles risk mitigation strategy derived from active discretionary trading: The Weekly Loss Limit.
The Logic: If the system commits a specific number of "bad decisions" (losses) within a set period, it effectively "fires itself" for the remainder of the week.
Why It Works for MR MR opportunities and failures tend to cluster.
The Good: Wins come in bunches during chopping markets.
The Bad: Losses cluster when the market trends aggressively (regime shift).
The Fix: By capping the number of allowed losses, the system moves to cash during the regime shift, preserving capital until the risk budget resets.
Why This Fails for Trend Following Importantly, this logic cannot be applied to Trend or Momentum strategies.
Trend/Momentum seeks convexity (asymmetric upside). It relies on taking many small losses to eventually catch a massive "home run" outlier.
The Risk: Capping the number of losing trades in a Trend system statistically guarantees you will miss the outlier event that drives the strategy's entire return.
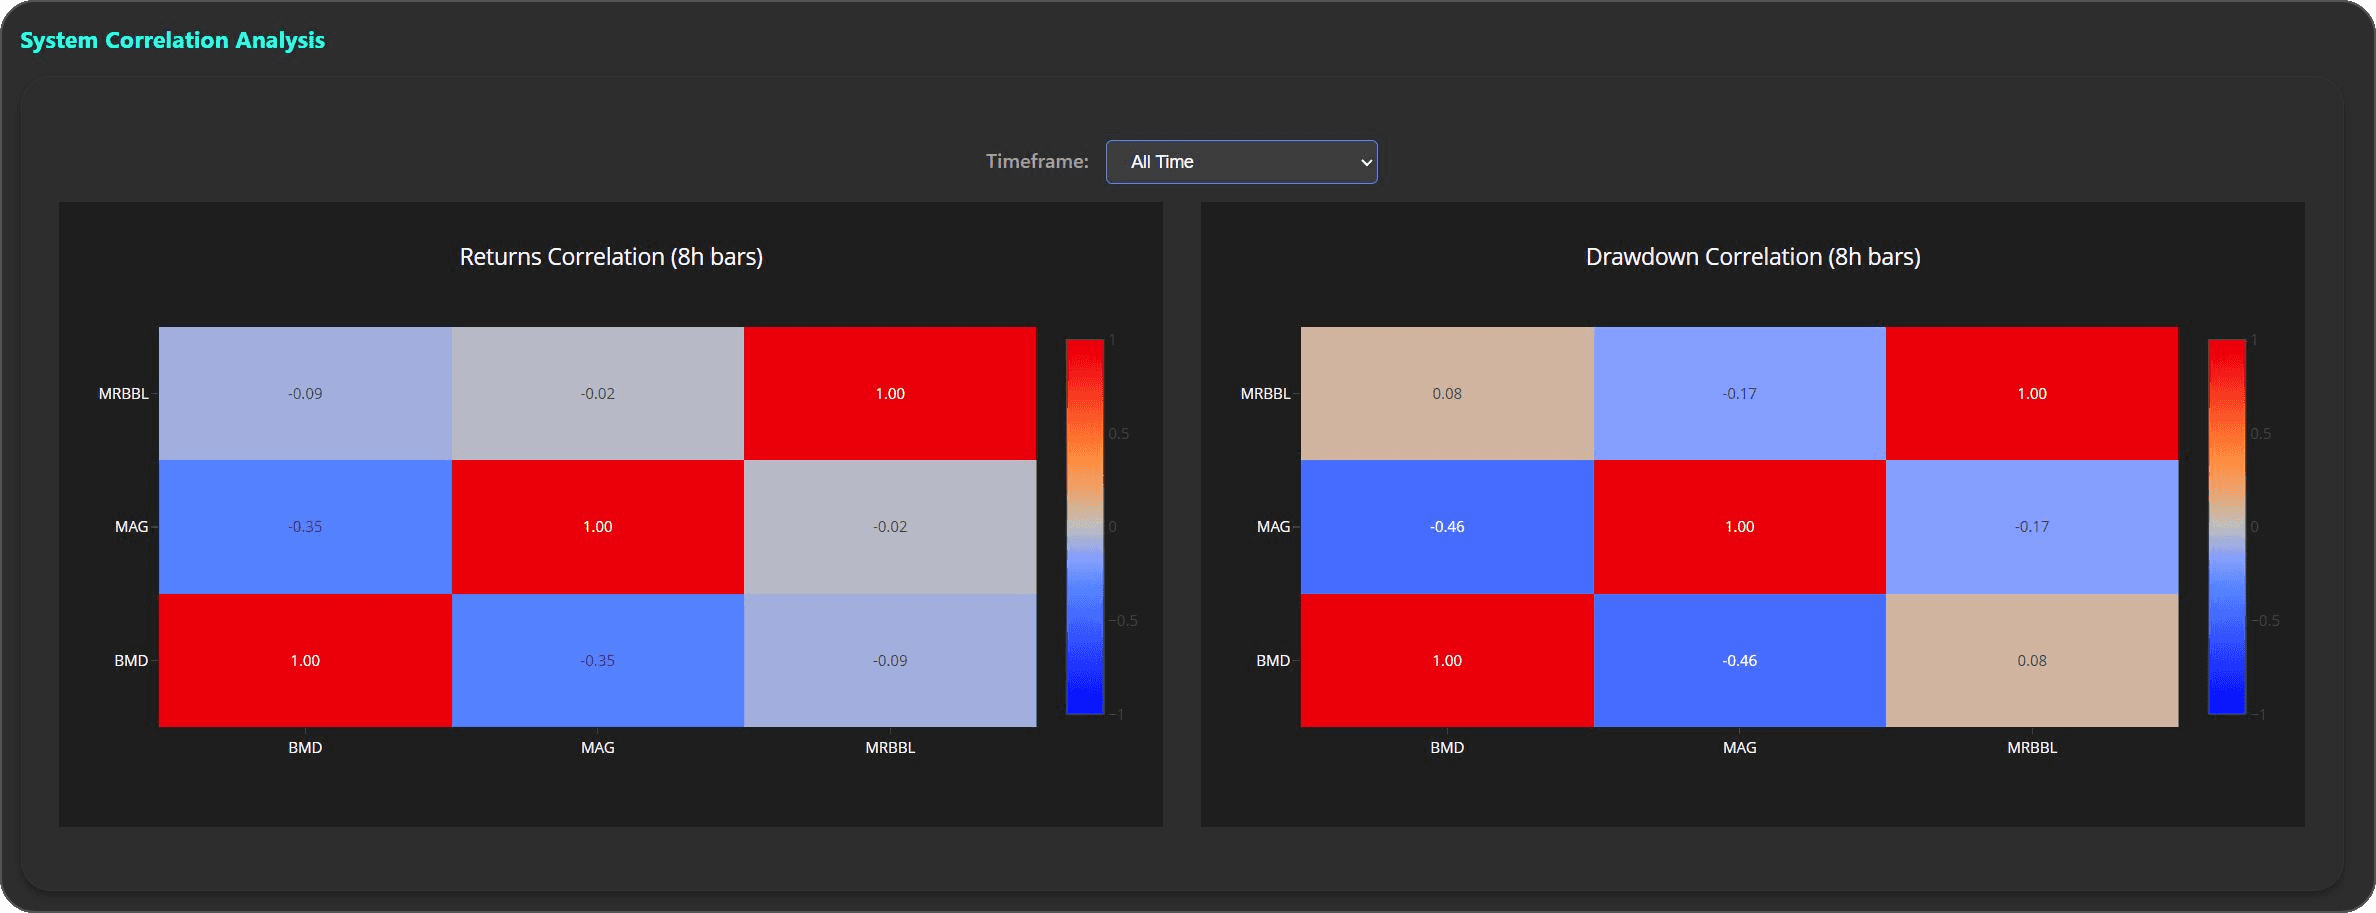
The Ensemble Approach To reduce reliance on any single logic, we employ an ensemble of MR components. By combining multiple systems that trade on different triggers and timeframes, we increase capital efficiency and create a natural, continuous hedging effect within the portfolio.
System Architecture: The Five-Component Model
To ensure robustness across market regimes, this Mean Reversion implementation is constructed from five distinct logic streams, each targeting a specific volatility profile.
1. The Volatility Shock Long (High Volatility)
Thesis: Capitalize on panic selling and liquidity gaps.
Mechanism: Active exclusively during high-volatility regimes. It executes when price deviates significantly below its volatility-adjusted fair value.
Profile: Aggressive Reversion (The "Knife Catcher").
2 & 3. The Failed Breakout Shorts (Low Volatility)
Thesis: In low-volatility regimes, breakout attempts often lack the energy to sustain and are rejected.
Mechanism: Fades upside extensions when price exceeds expected range limits during quiet markets.
Specification Diversification: We utilize two variations of this logic. While similar, they use slightly different directional measures to capture a broader spectrum of "failure" setups, ensuring the system triggers on both sharp rejections and slow rolls.
4. The Retracement Long (Low Volatility)
Thesis: Capture the "reload" phase. When a breakout is rejected and price drifts back, it often sets up for a secondary attempt.
Mechanism: Filters out high-volatility periods (to avoid catching a crash). It targets downside drifts in low-vol environments, positioning for a rotation back toward the upper range.
5. The Retracement Short (Normal Volatility)
Thesis: Fade the relief rally.
Mechanism: Filters out the low-volatility periods used in components 2 & 3. It focuses on normal volatility regimes, looking for upside corrections (dead cat bounces) following a breakdown, anticipating a return to the lows.
Summary By layering these components, the system achieves Regime Smoothing. It hunts for capitulation during panic (Comp 1), fades false moves during consolidation (Comp 2, 3), and trades the internal rotations of the range (Comp 4, 5).
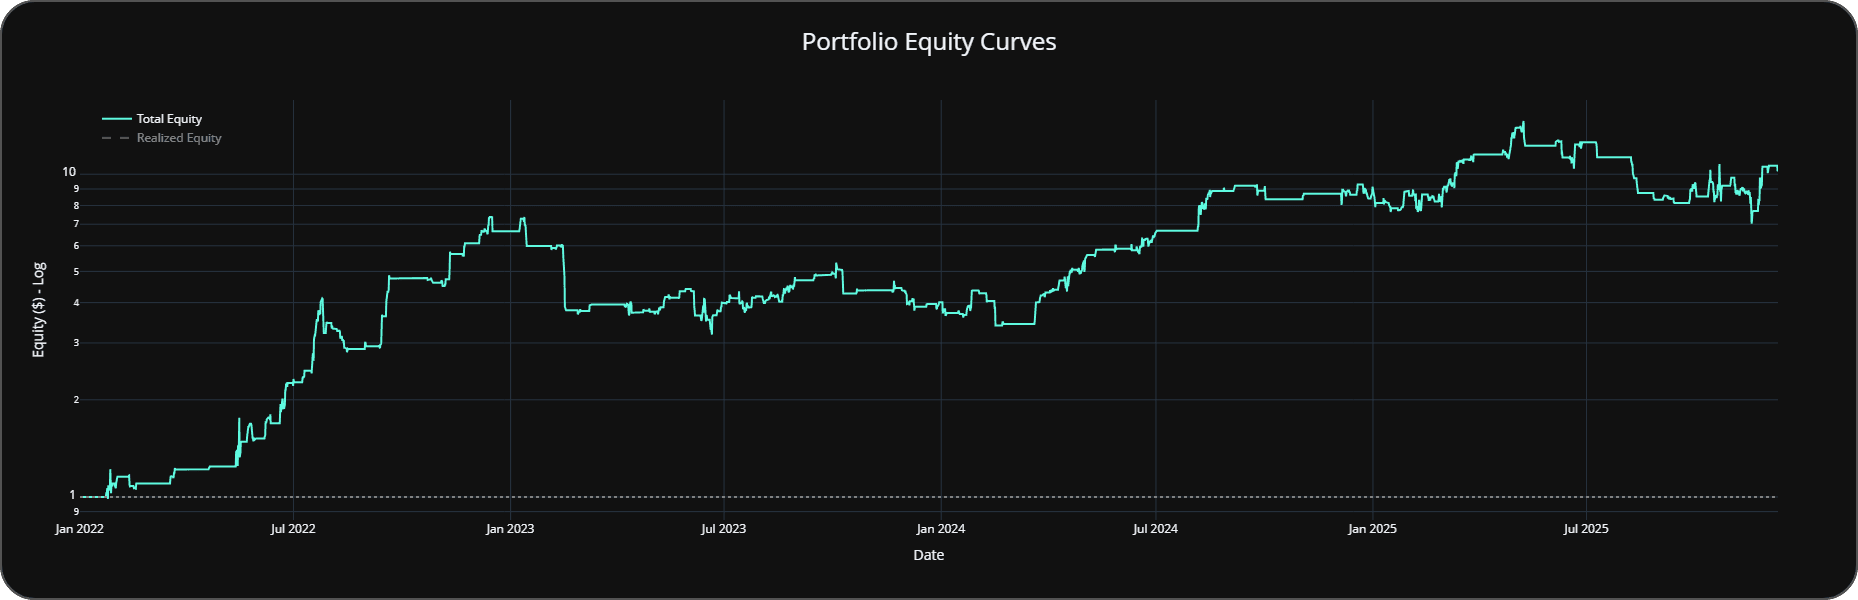
Overview