


How the Strategies Were Built
How the SOVEREIGN Client strategies were constructed: risk premia, components, and what the paths must survive.
A non-exhaustive look into how the strategies were built
Risk Premia
The strategies below are risk premia: ordinary ways of getting paid for holding a position through a particular kind of market. They are supposed to look ordinary. They are supposed to look ugly in the regimes they were not built for. An equity curve that is smooth in every year and every kind of market is the pattern that we cannot trust.
What we are trying to capture is a price move. Momentum holds a coin because that coin is going up. That rise is the premium. It will move up together with the broad market. The token will also go up on days we are not allocated. The relevant test is whether the price increase is larger, and a bit cleaner, while we are in the trade. We are not trying to be market/delta neutral or hedge out BTC.
A strategy is a small stack of those rules. Five of them are in this note: an 8-hour momentum strategy (MOMO 8h), a one-day mean reversion strategy on eight names (MR), the same mean reversion with momentum shorts on ten names (MRC), and the momentum idea again on a 12-hour and daily timeframe. The system actually run in Sovereign Client is composed of these strategies, sized so each position carries similar risk, plus a trend-following long strategy and a trend-following short strategy. A single strategy can draw down by about 50%. That is what this kind of premium does once it is sized. A system itself is capital distributed to multiple strategies.
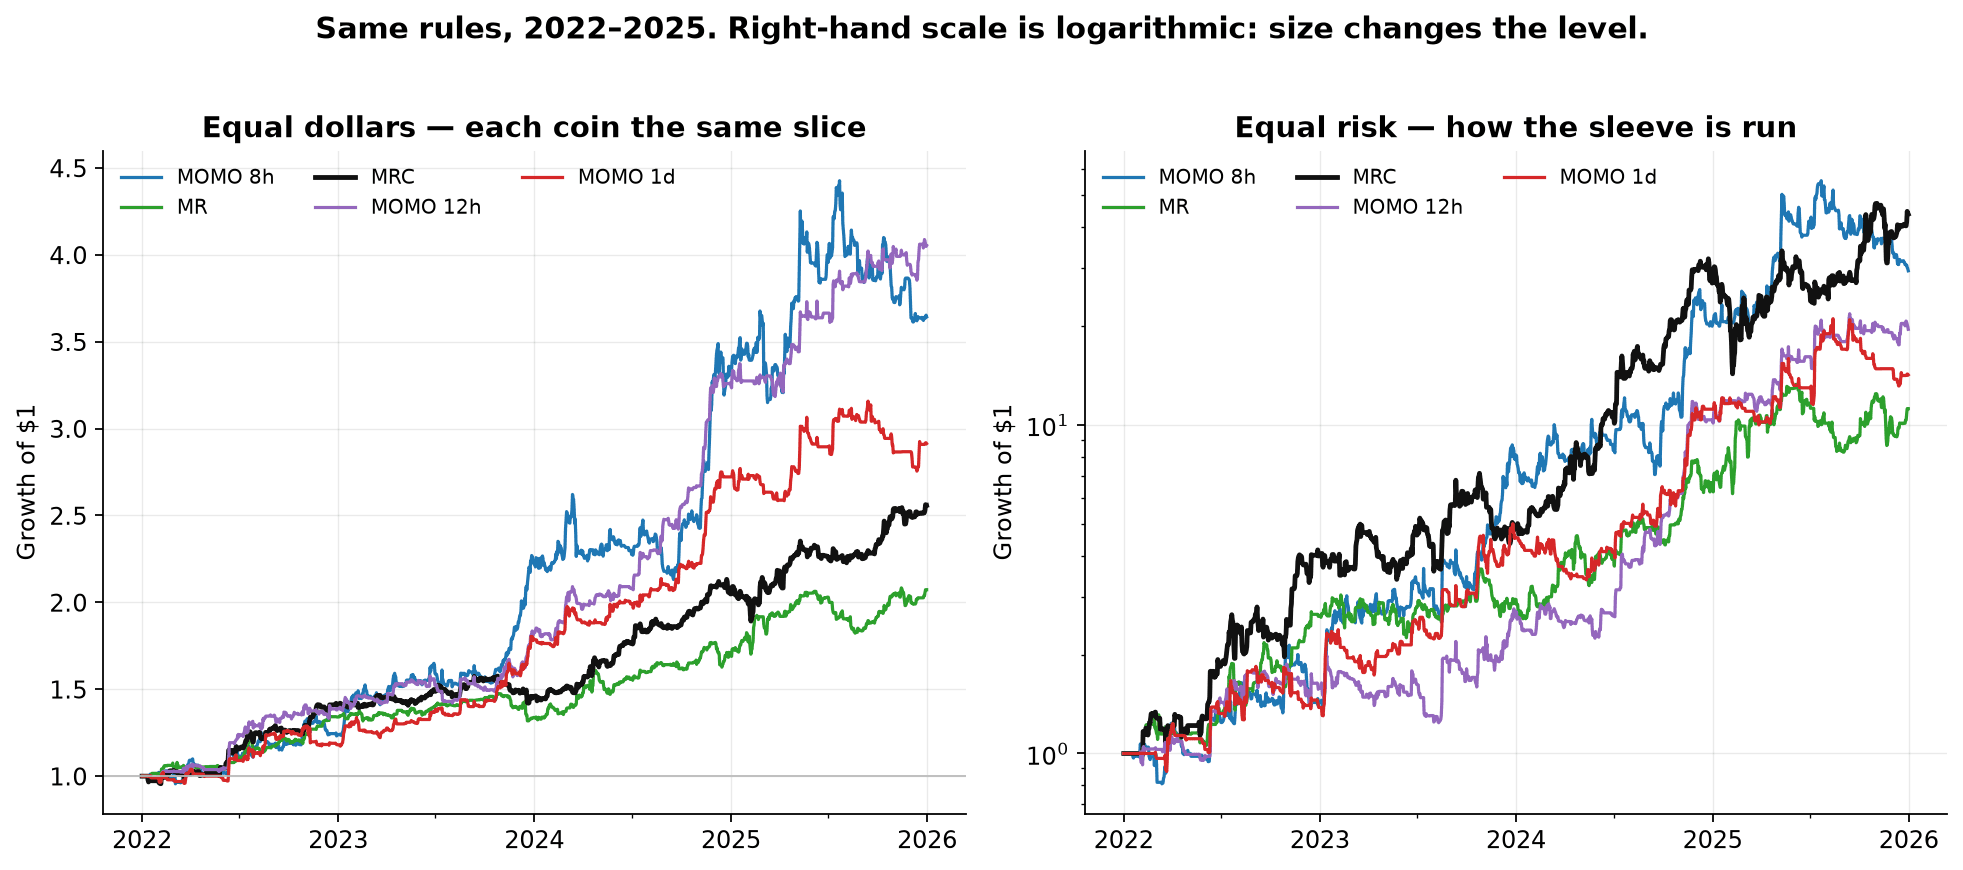
The left-hand chart gives every coin that is in the traded universe the same dollar allocation of the strategy. That slice is one share of the list: 1/10 on the ten-name majors list, 1/8 on the eight-name Mean Reversion list. The right-hand chart is how the strategy is actually run. Each position is sized volatility adjusted, so that a typical swing risks a similar amount, then capped by Hyperliquid's leverage limit. The scale there is logarithmic for proper visual display. It ends up higher because the individual trades are sized up and compound.
The sample used to describe the rules: January 2022 through December 2025. During the initial time of strategy creation, 2025 was the year set aside for out of sample comparison. Since then we have explored the data of 2025 as well. Since February the rules have been running unchanged. January 2026 is excluded here. The universe on the live strategies is a quarterly list of liquid majors: ten names, eight for the MR strategy. A name is traded only in the quarters it was on that list.
How a strategy is built
A strategy is made up of multiple components. A single component can be one price setup on a single side (e.g. long only or short only) and one holding period. Simple Example: seven up-closes, then a dip that still holds a 20-period average - stay long for about a day. Each component is created with a clear rule that captures a certain behavior or price pattern
A strategy is those components run together:
One position per name. If two momentum rules both want Bitcoin long, the strategy holds Bitcoin long once.
A fixed hold on each side. For example three days for 8-hour momentum longs, about two days for its shorts, about a day for the mean reversion strategies, about two days for the 12-hour and daily momentum strategies.
An opposing signal closes the open side, with one flat bar between a flip.
On this majors list the coins move together. Correlation measures how much two series share a move: 1 means they behave the same, 0 means that 50% of the time they move together and 50% of the time they oppose each other. BTC and ETH daily moves line up at about 0.83. Across the rotating list, a typical pair is about 0.64, and a typical coin lines up with BTC at about 0.67. In Crypto there is no stock-market-style set of unrelated names here. Sectors exist in crypto, but they are still reliant and correlated above 0.5 to the broad market.
So when the market is rising, momentum trades open on several names at once. That is the design. The 8-hour momentum strategy holds about three names at a time on average, out of ten. The mean reversion strategy holds about one, out of eight, and its long rules overlap on the same name only about 6% of the time they are active. Momentum's long rules agree with each other more often: about 15% of the bars where an 8-hour long is traded, and about a third on the daily breakouts. The strategy still trades the coin once.
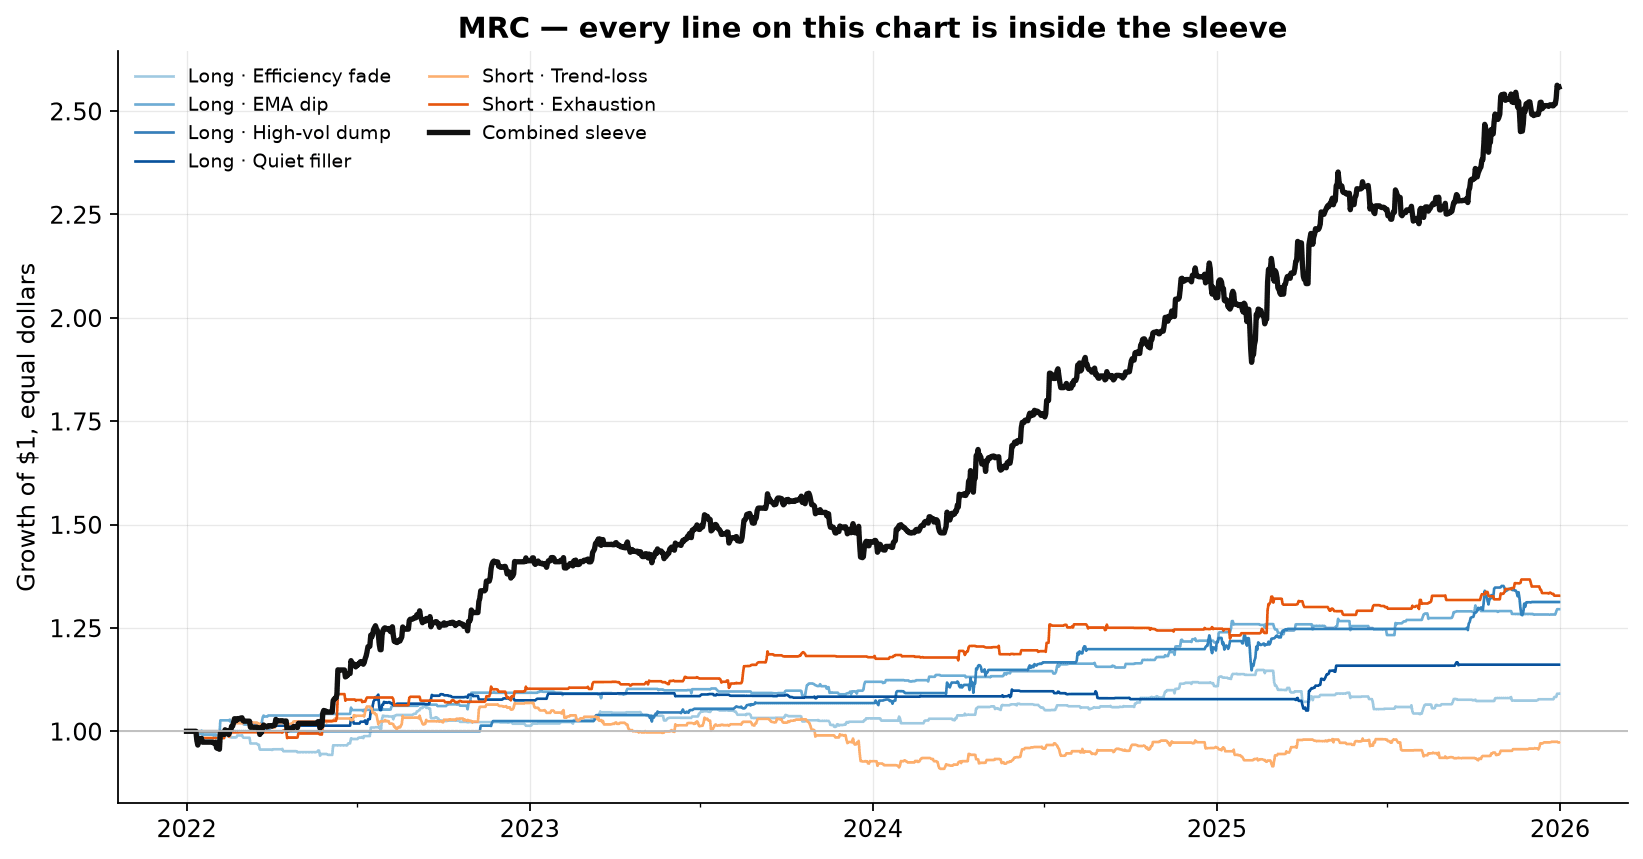
MRC is a clear picture of a strategy. Each thin line is one component. The dark line is those same rules run as one strategy, one position per token. Every line on the chart is inside the strategy. The components are modest on their own. Together they form the strategy.
The same two short rules - trend-loss, and exhaustion - are reused on the 12-hour and on the daily momentum strategy. Especially short side components can underperform in single strategies easily, but can be additive in others, including on different timeframes. Still the short side is generally the weaker side and will be the first one to receive new component(s) capturing different short expressions.
Each component undergoes "sanity" checks. One example is a parameter band test ensuring that the selected parameter is not luck or an artefact of any accidental data mining. Below is a basic Bollinger Band breakout that I recently used to display precisely how to think about this kind of parameter robustness.
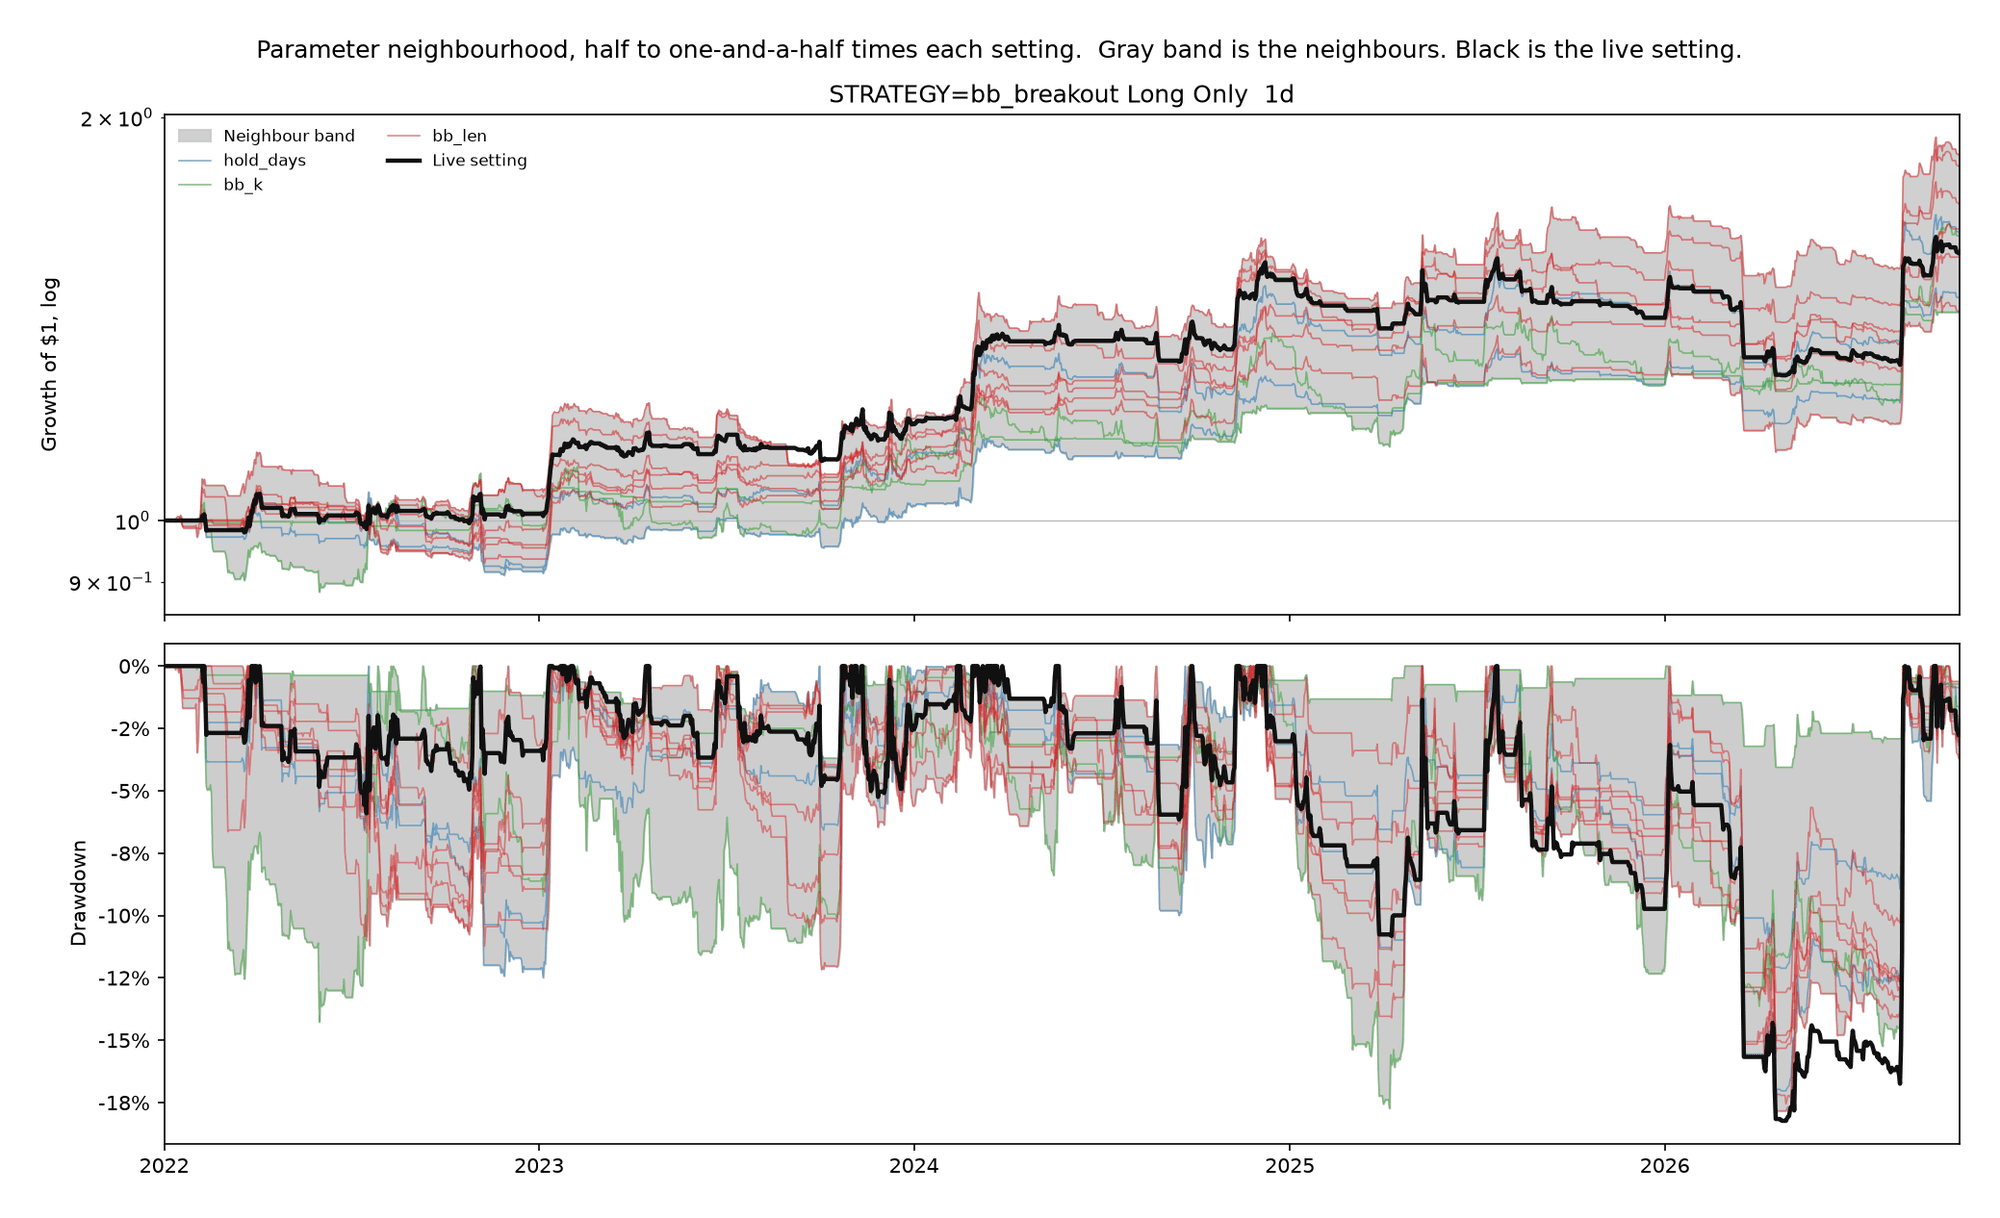
This displays a band of all ranges of individual parameter changes including the holding duration, the lookback length and the standard deviation length. The parameter range goes 50% down from the selected parameter and 50% up. E.g. a length of 20 will be compared to anything from a length of 10 to a length of 30.
Importantly this exercise does not justify or suggest choosing a different parameter. We merely aim to see the selected/default parameters to be in the range of possible outcomes and not somewhere far above the band. Do note that temporary patches above or below the band are fine and can be produced by chance for any combination and logic. What would not be normal is if the live setting is consistently outside that band.
There is also more than one version we can run on that. What the above does is changing each parameter individually. But what happens if we change multiple parameters at once? Doing so can show the range in which a certain signal is actually working and at which point it breaks.
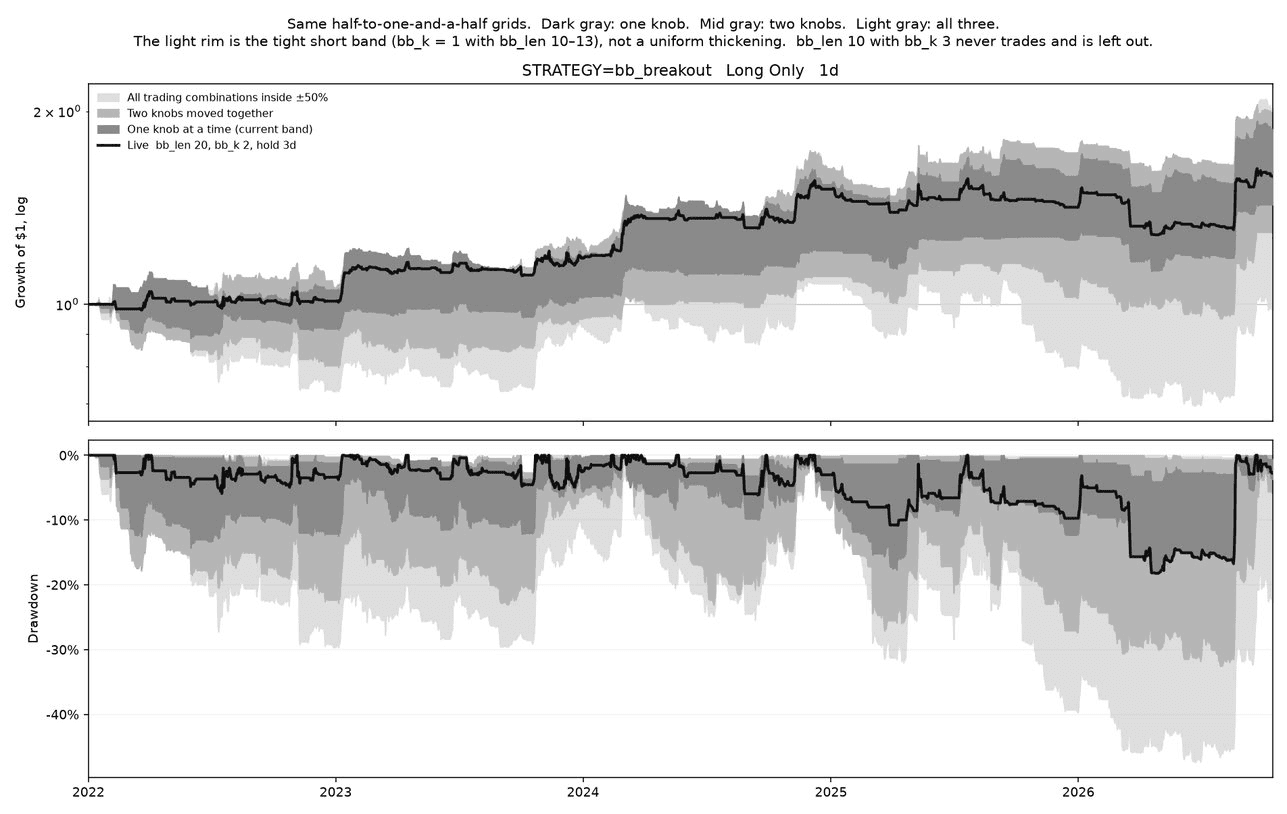
Here the dark gray is the same band as in the image above, the mid gray is the range we get by changing two parameters together and the light gray is the result of changing all parameters. Notably the part that breaks and becomes the lower bound on the light gray is a specific range of parameters mentioned in the title. That is the point where the range of possible breakout logic ends and where it just becomes noise (or is never traded).
The token behavior when in a trade compared to when not in a trade
One way to distinguish if our rules make sense or not is by looking at the price behavior while we are in a trade vs the normal price behavior while we are not in a trade. What we aim to capture while being in a trade is a cleaner and more directionally advantageous price move than what will happen outside of the trade. Meaning price will move around anyways at varying levels of volatility. However when we receive a signal from a component and enter a trade then we want to capture a cleaner price move than what otherwise happens outside of the trade. This does not mean that price doesn't move directionally outside of our trade. It also doesn't mean that our trade intends to capture the whole price move. It only means that on average what the trade captures will be a reasonably clean move we can extract/predict and harvest.
To illustrate that we want to look at the following chart.
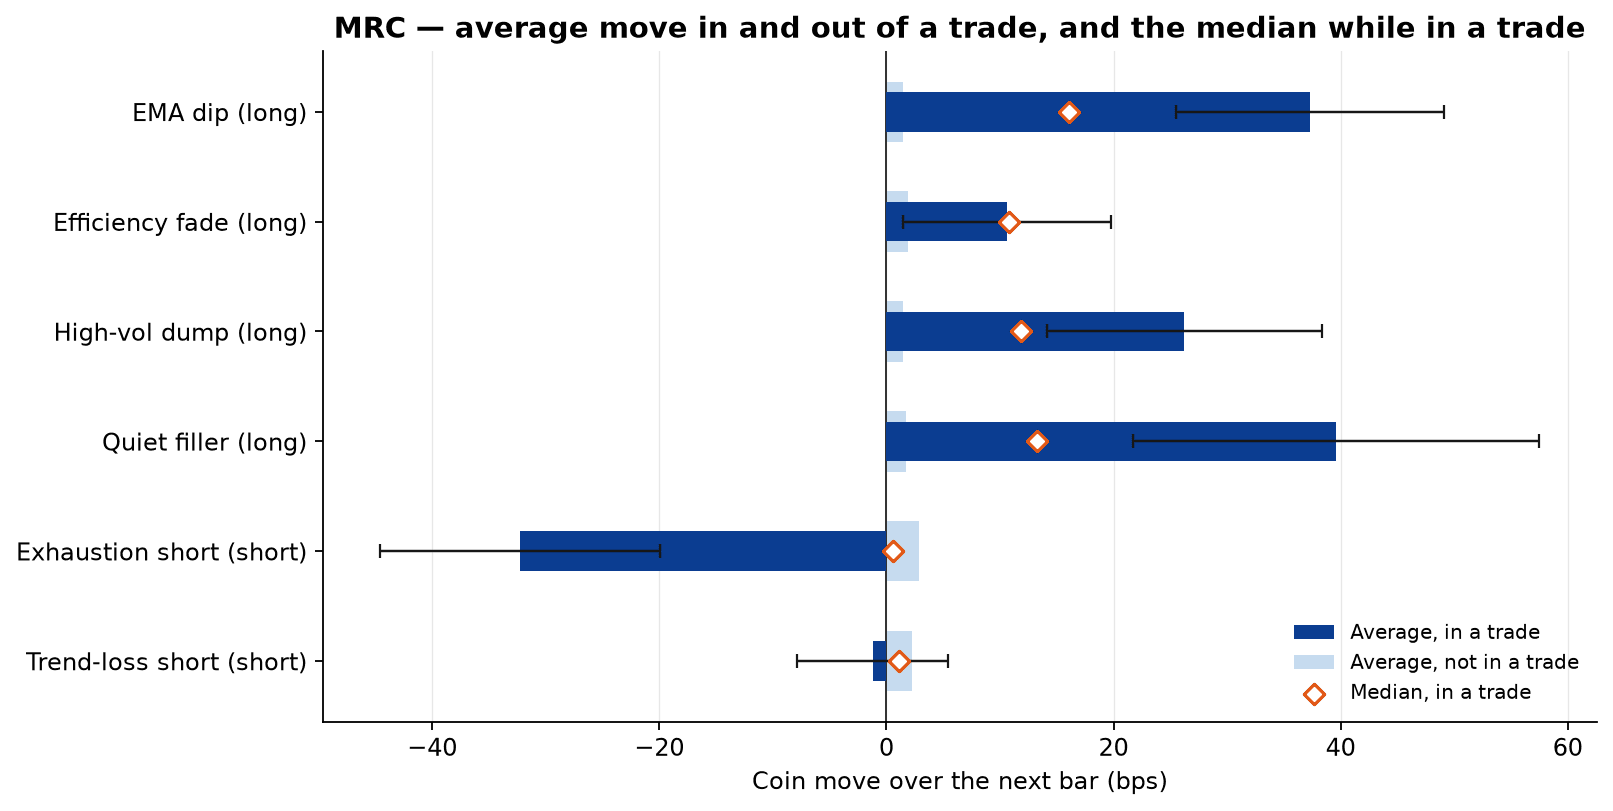
This chart displays each component of the MRC strategy. Each component shows the tokens own next-bar move when not in a trade. Typically 2-3 bps. bps means hundredths of a percent. Ten bps is a tenth of one percent. So 100 bps == 1% 50 bps == 0.5% 3 bps == 0.03%
This is the average price movement. When these components are in a trade, the dark bar shows how the average price moves during the trades. The diamond is the median of those same in-trade bars. Price going up when in a trade is displayed by the bar going right. Price going down during the trade is shown as the bar going left. For longs we want price to go up (right); for shorts we want price to go down (left).
On top of each trade bar, we see the black line. This is a day-clustered bootstrap standard error. What that means - Calendar days are resampled 400 times with the coins on a given day kept together. The black line then is the standard deviation of those 400 means. This shows us that there is some variance in the price behavior. Meaning just because the bar gives us a fixed forward bps doesn't mean that each trade is like that, rather that in different market conditions and different periods we have some volatility around what the average trade looks like.
EMA dip (long) The average move in the trade is about +37 bps, median about +16 bps. Both sit well to the right of the flat-market move of about +1.5 bps, and the error bar stays out there too. The median trade is already an up move. A smaller set of larger up bars pulls the average higher.
Efficiency fade (long) Average and the median are both about +11 bps, so this one is not a tail effect: a median bar looks like the average. It is only a small step above the flat-market move of about +2 bps, and the error bar reaches back to that flat move. The direction is right, the "edge" is weak but consistent.
High-vol dump (long) The average is about +26 bps and the median is about +12 bps. The error bar stays above the pale bar. The median trade is an up move, and larger up bars make the average about twice the median.
Quiet filler (long) The average is about +40 bps, median about +13 bps. The error bar is the widest of the six. The average is still clearly above the flat move of about +1.5 bps. The median trade is a smaller up move, and the high average comes from fewer, larger bars, which is why the average is the least precisely estimated (wide error bars).
Exhaustion short (short) Average move in the trade is about -32 bps with negative error bars. This is the direction a short wants. The median is about +0.5 bps, essentially flat, while the same coins average about +3 bps when this component is not in a trade. The median bar does not fall. The average fall comes from a minority of large down bars. Essentially harvesting the tails.
Trend-loss short (short) The average move is about -1 bps and the median is about +1 bps. The flat move is about +2 bps. The error bar covers both small rises and small falls, and it covers the flat-market move. On this timeframe the next bar does not reliably fall while the short is in a trade.
Component performance over time
A risk premium is allowed to have a bad year. It is allowed to lose money in a market it was not built for. Not because we want it to lose money or like losing money, but because by it losing in regimes it was never meant to handle it shows that it does the job it was given and is robust. The alternative is a signal seemingly making money everywhere which is great in theory but will fail in practice and shows that either the calculation/data is outright wrong, or that we are taking on some risk that has not yet expressed itself and we would be ignorant about (think of the turkey chart), or a risk that is front loaded into the future (awesome looking martingale equity curves), both can be true at once. Therefore the pattern to question is a rule that looks strong in every regime.
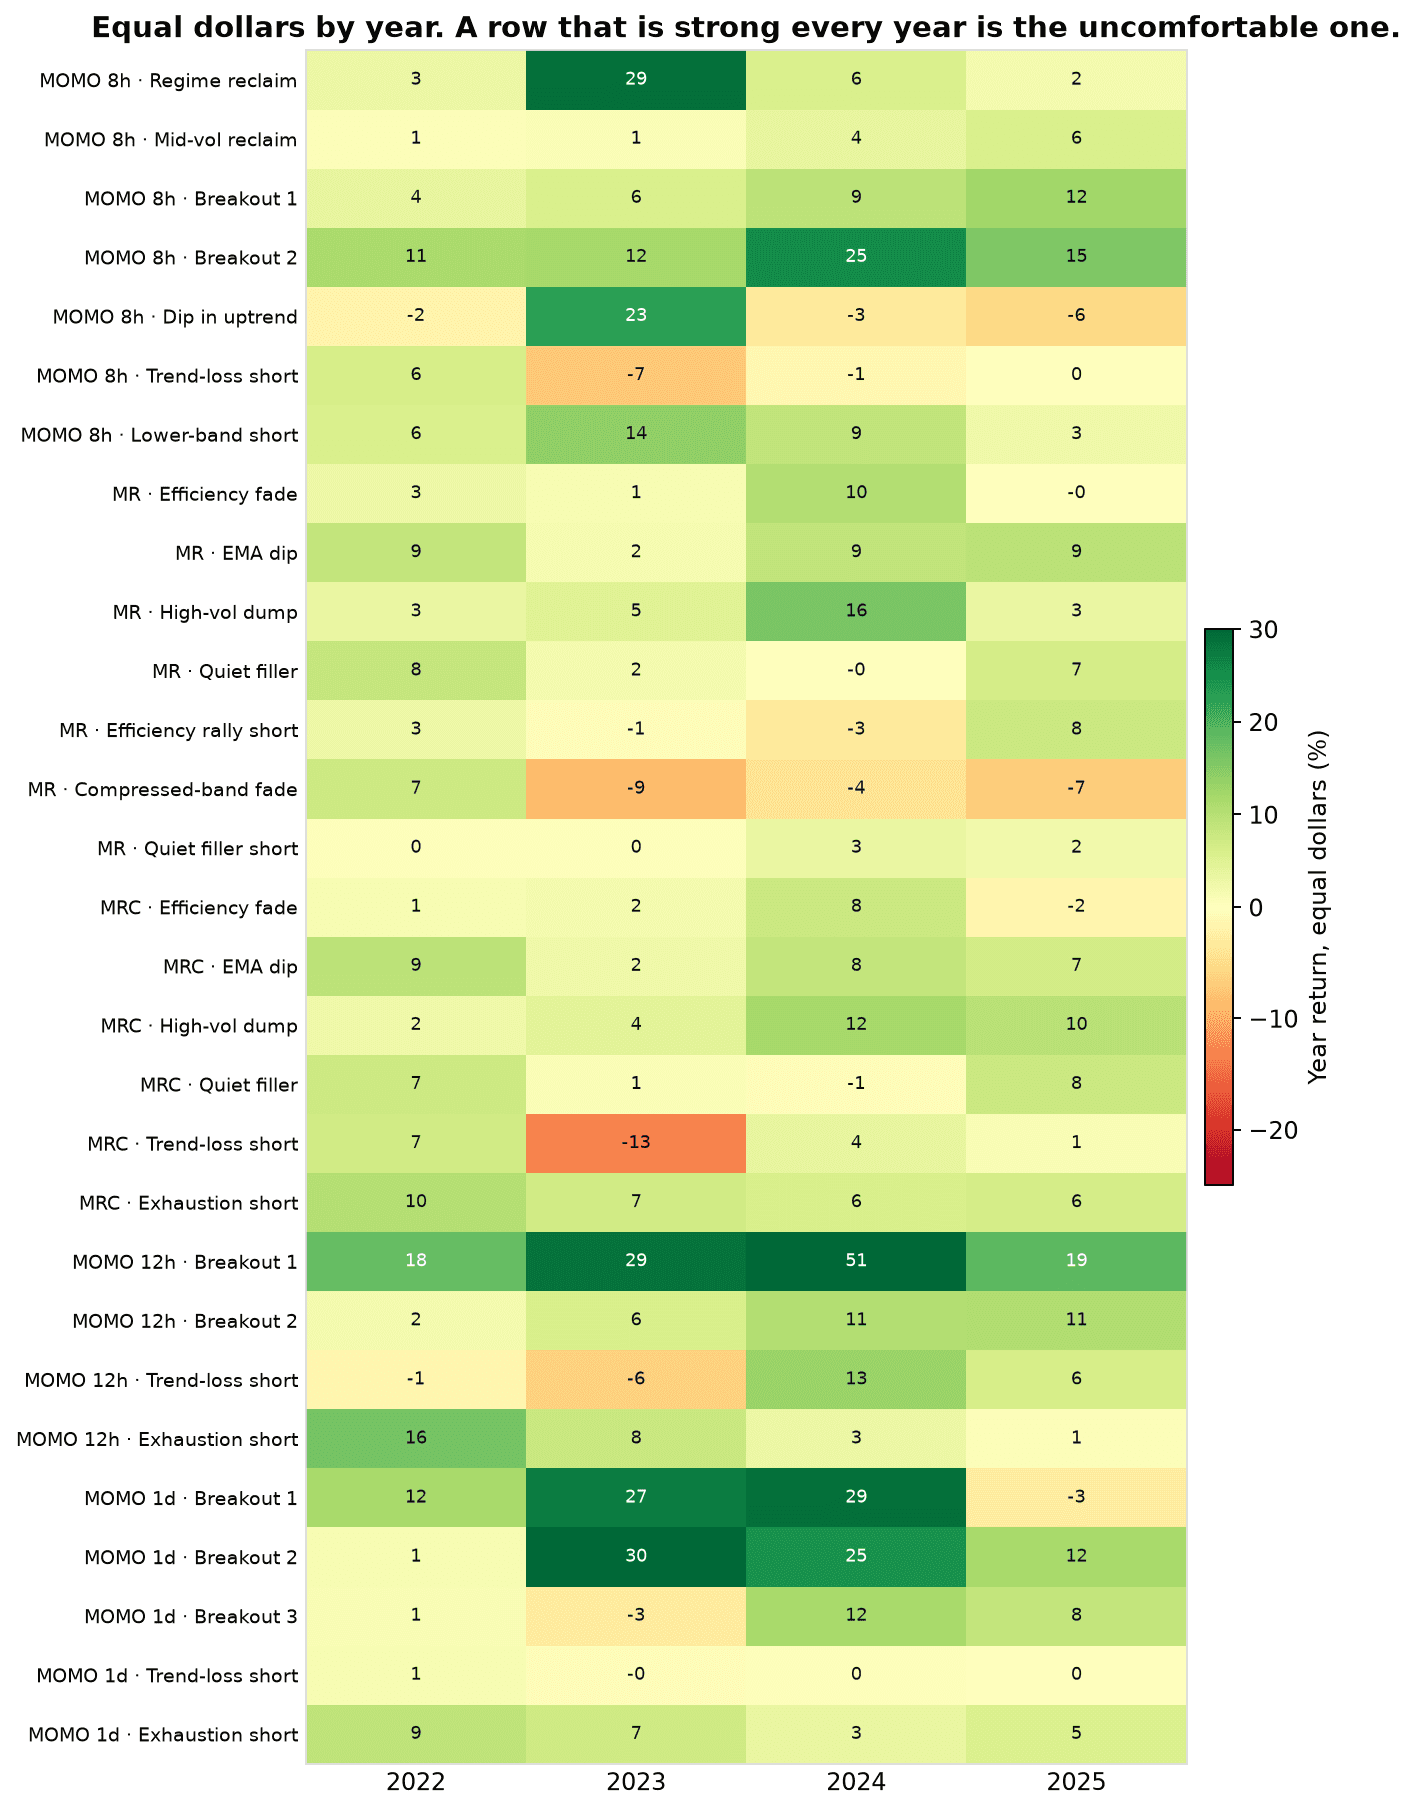
Each cell is that rule's own equal-dollar result for the calendar year, in percent. Most cells are small. A component is a slice, and a slice that makes a few percent in a year has not proved anything grand. It has also not broken.
Two things are worth seeing.
The dark row is the 12-hour breakout, up in every year and up about 50% in 2024 on its own. That rule is a plain breakout rule. It still goes through bad regimes they just don't show up as visibly over the yearly.
The orange cells are rules in a bad regime for them. The dip-in-uptrend long loses 2022, 2024, and 2025 and has one strong year. The compressed-band fade loses three years out of four. Trend-loss on the 8-hour books loses 2023 and is otherwise small; on the 12-hour book it loses the first two years and makes it back in 2024 and 2025. Those are not certificates, neither are they a reason to pretend the rule was never part of the strategy. They are the epitome of regimes affecting the different rules. Of course even throughout losing years we can find pockets of better and worse performance as the regime duration is not fixed and generally varies.
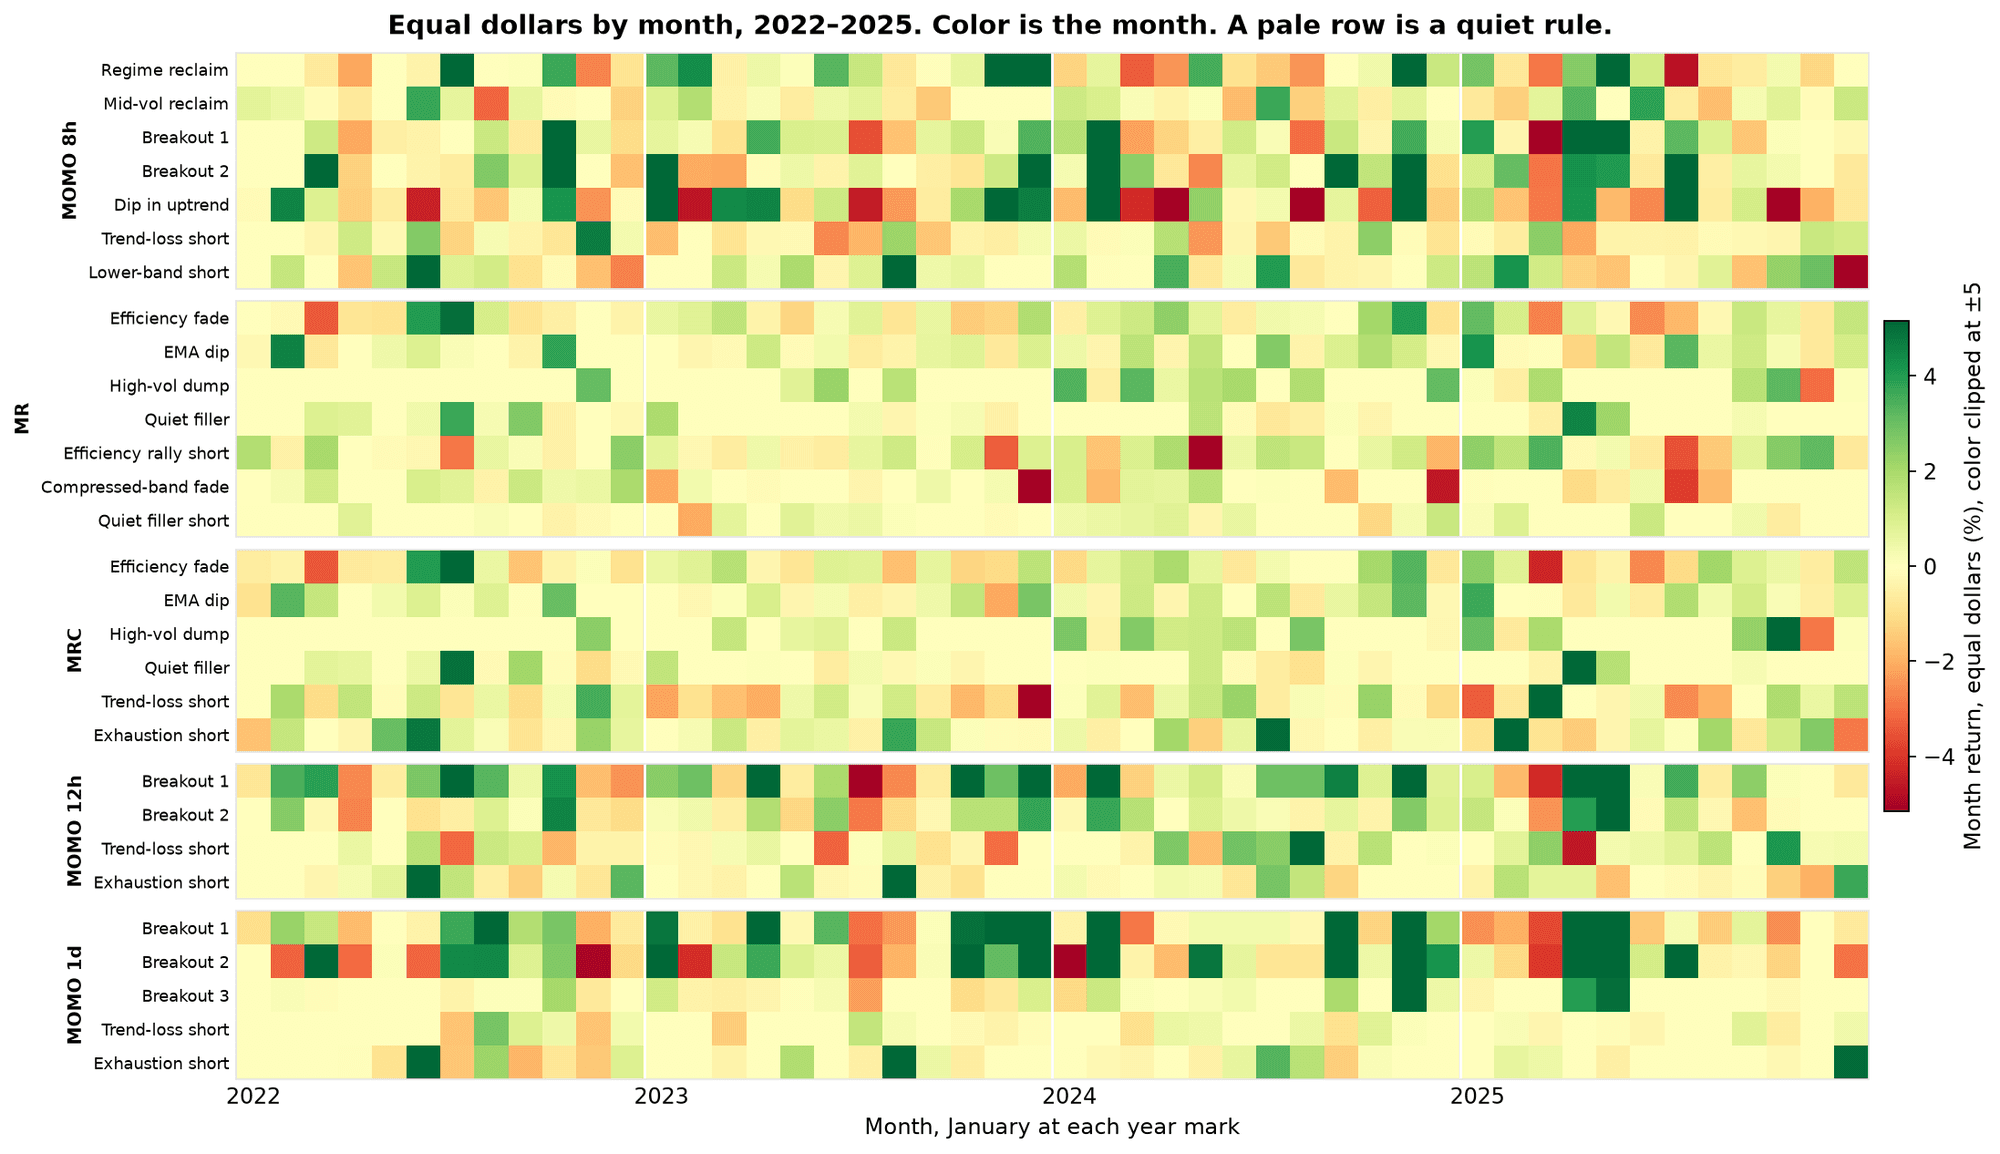
The same rules, one cell per month. The scale is capped at 5% either side for visibility. White lines are the years. A pale row is a quiet rule. The 12-hour breakout's strong yearly record shows on higher granularity to be multiple strong green months and many weak orange/red months, cleanly displaying the regimes within the overarching yearly records.
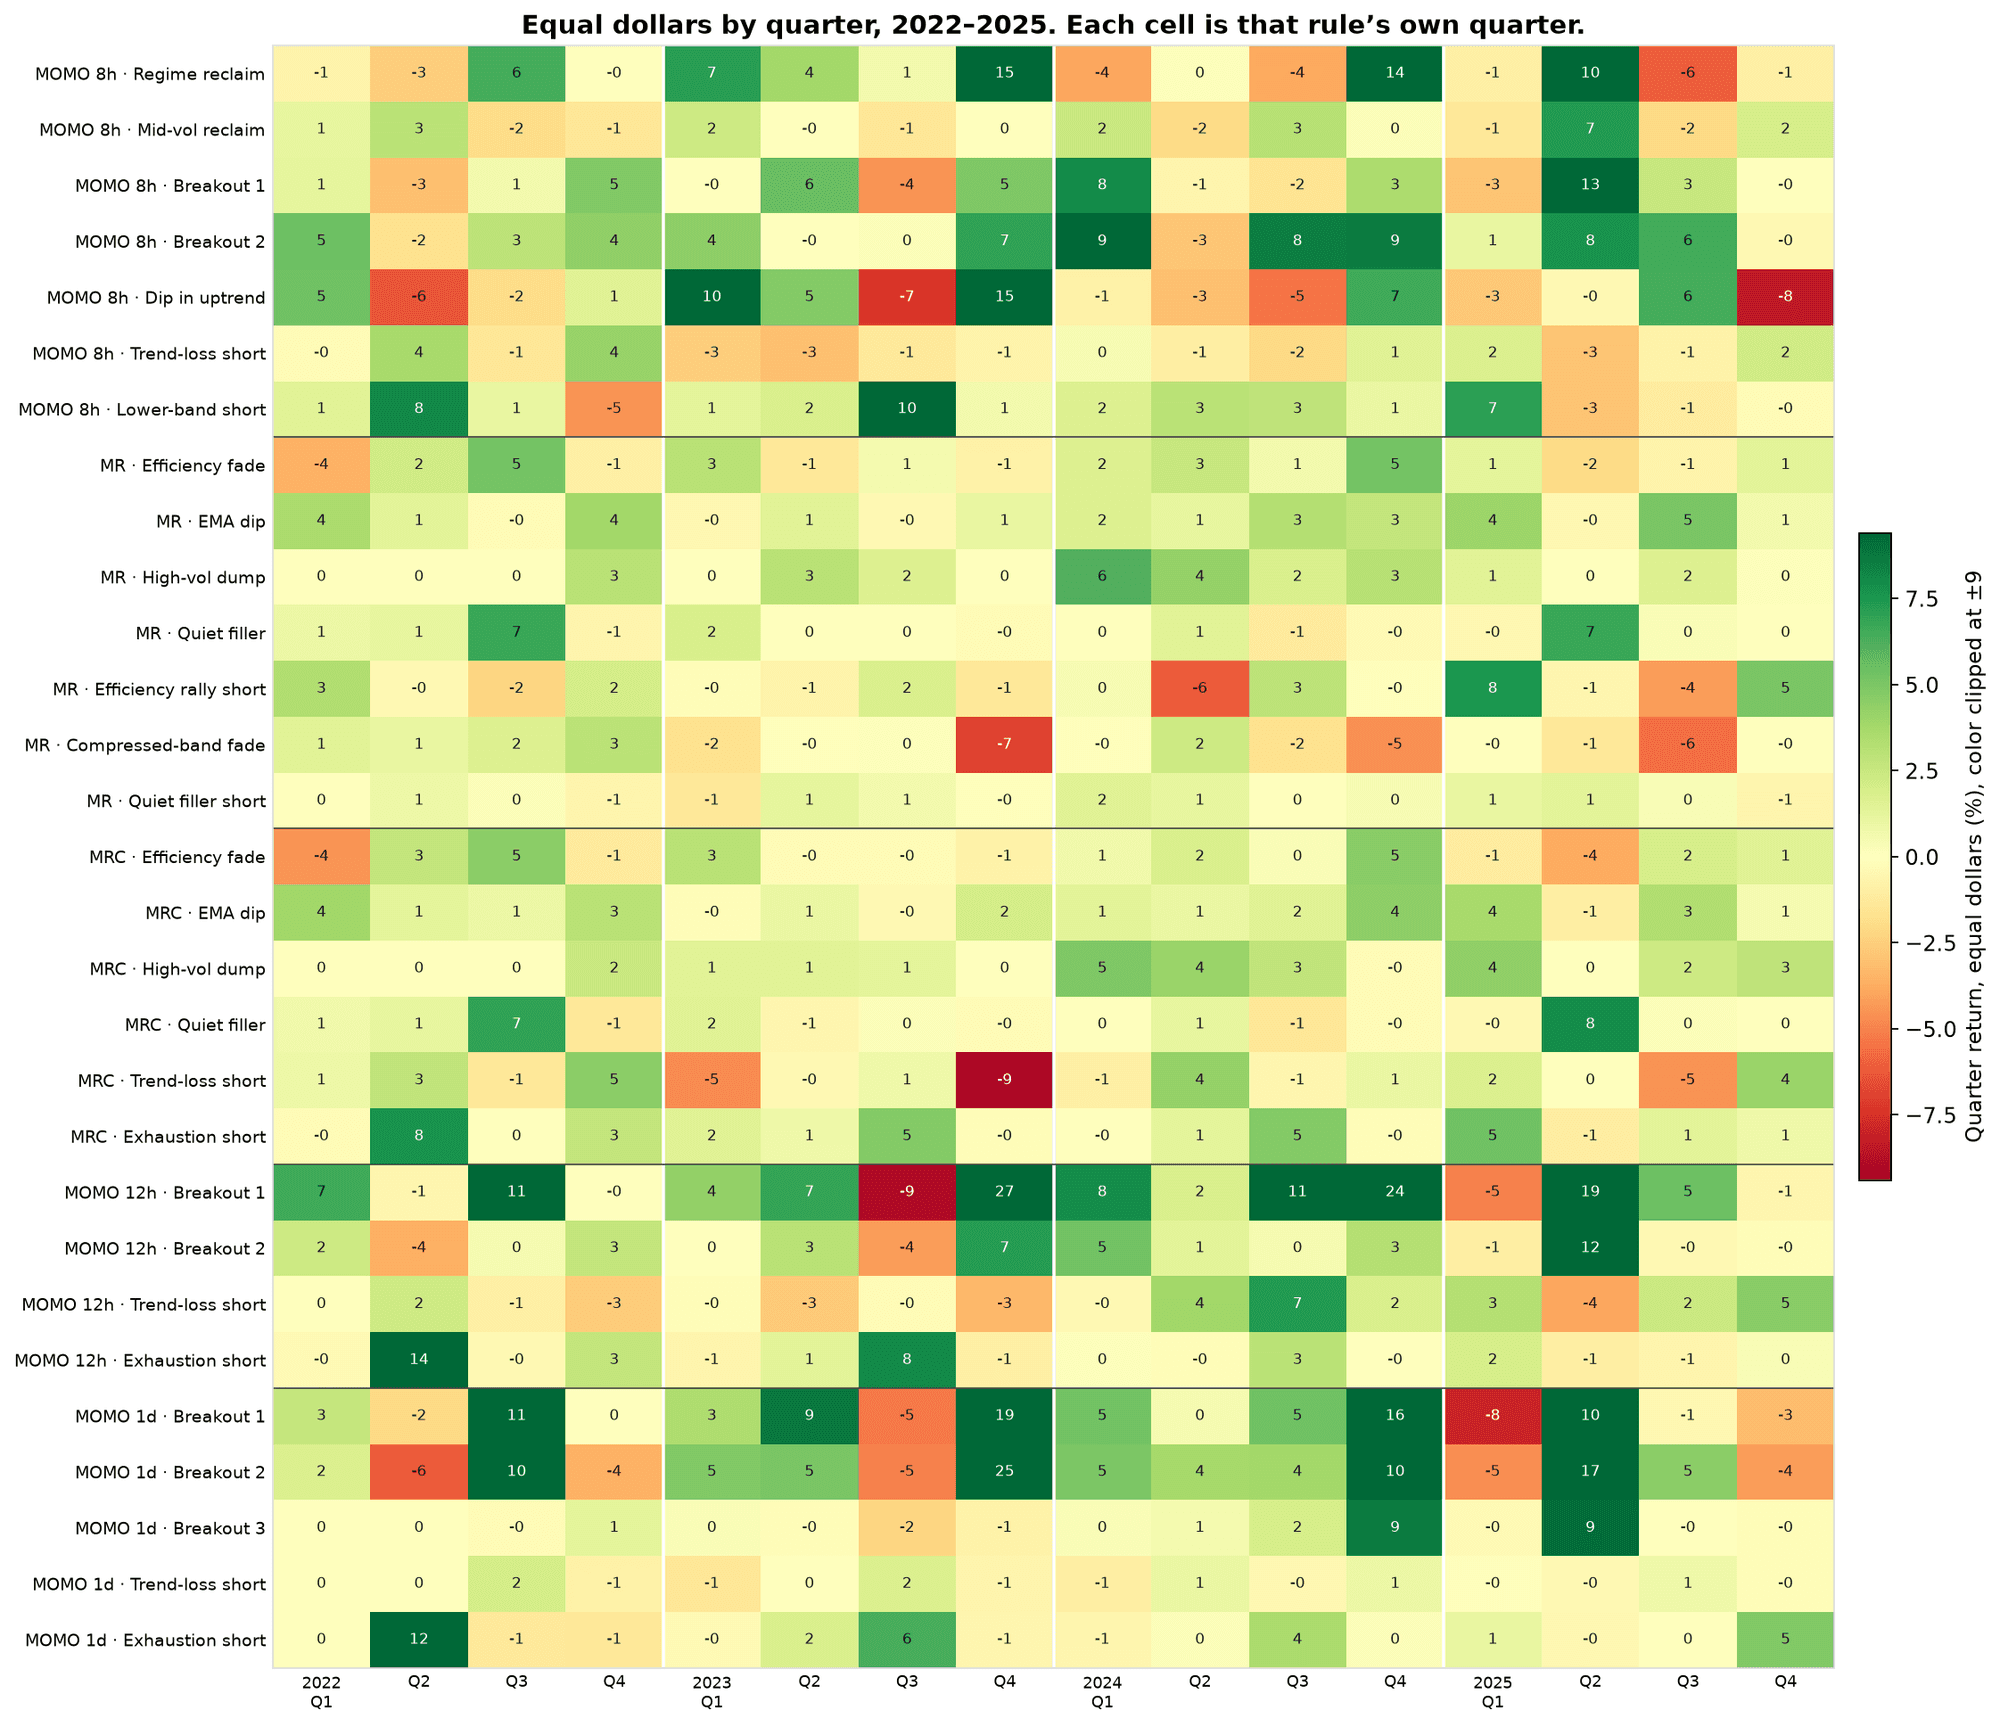
Each cell is that rule's own equal-dollar quarter, in percent. The scale is capped at 9% either side. The number in the cell is the quarter itself, including the ones past that cap. No row is up in all sixteen quarters.
What the strategies are for, and what they must survive
The job of a strategy is to get paid when the market it was built for shows up, and to be survivable in the rest. Survivable does not mean flat. Momentum, once sized, will have strategy drawdowns of about 50%. So will mean reversion. In 2022-2025 the equal-risk strategies already printed worst drops of about 47% (MOMO 8h), 38% (MR), 55% (MRC), 37% (MOMO 12-hour), and 38% (MOMO daily). That is the premium's cost of being in the trade.
A slower fill and a trading cost are part of the same question. The paths already charge the Hyperliquid fee of 0.015%, plus a slippage allowance on top of that fee. Live fills have often been kinder than the slippage allowance. The allowance is there so we don't delude ourselves into thinking that all execution will be great. Another test involves waiting one extra bar (equivalent to the strategy timeframe) - this hurts the one-day mean reversion much more than it hurts a two-day breakout, which is what a short hold is supposed to do. Section 7 deals with funding, which is measured on its own.
An 8-hour bar has to start somewhere. This strategy trades the 8-hour UTC bar. That bar opens at 00:00, 08:00, or 16:00 UTC, so the close lands on midnight on one bar in three. The same bar can start one hour later, or two, and so on. There are eight of those clocks. They are the same coins and the same years. Only the start of the bar moves.
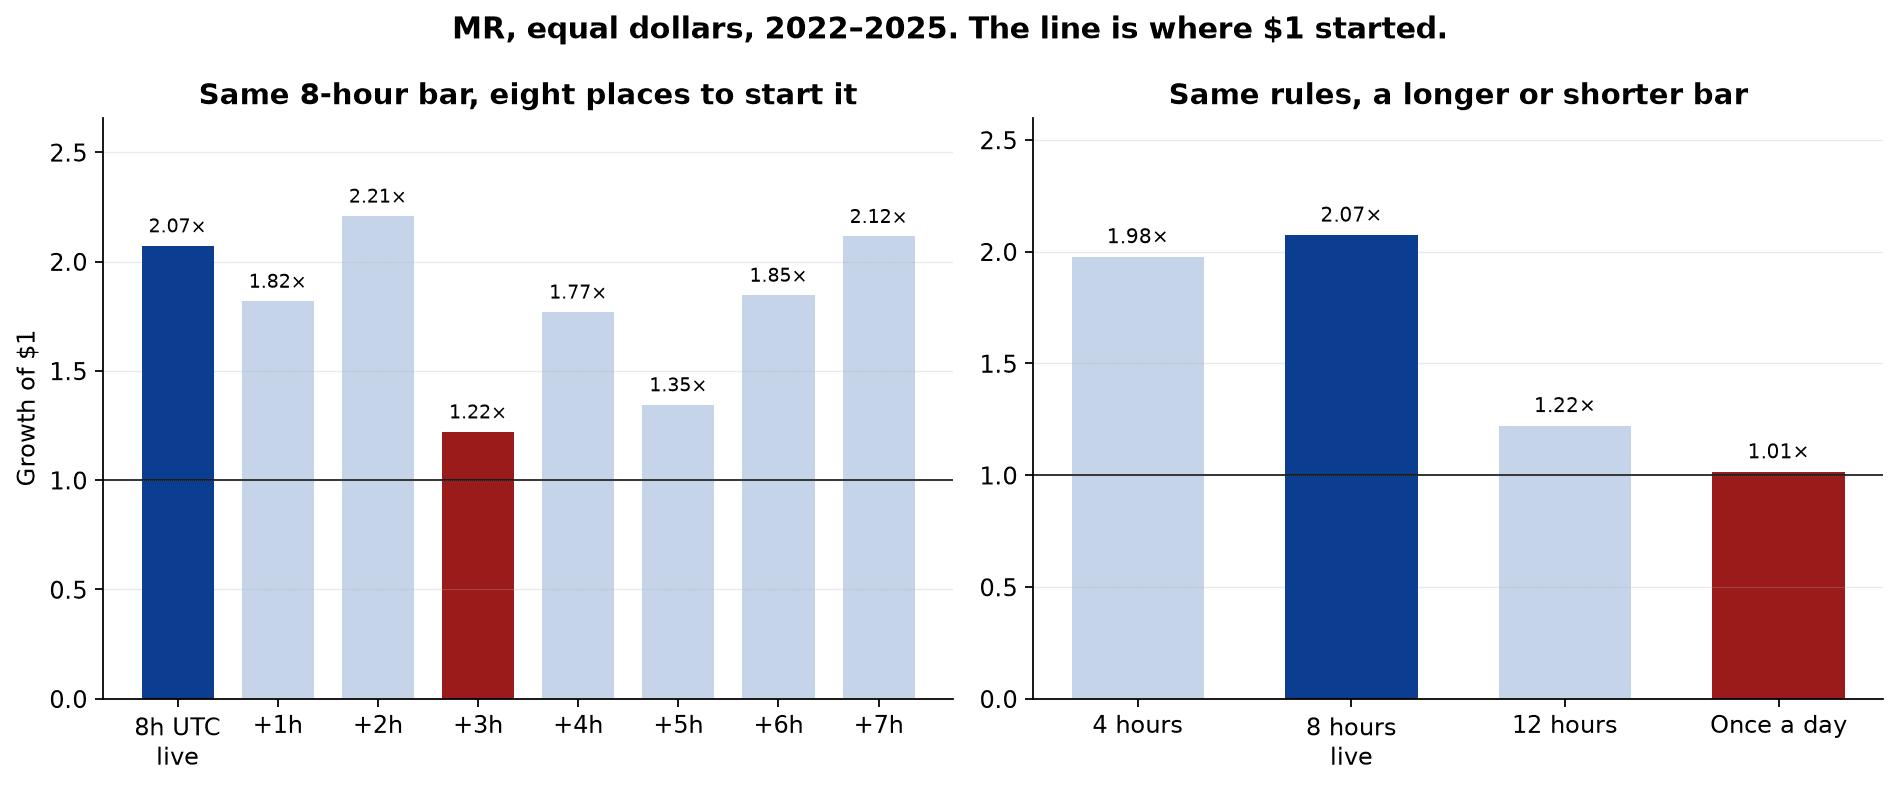
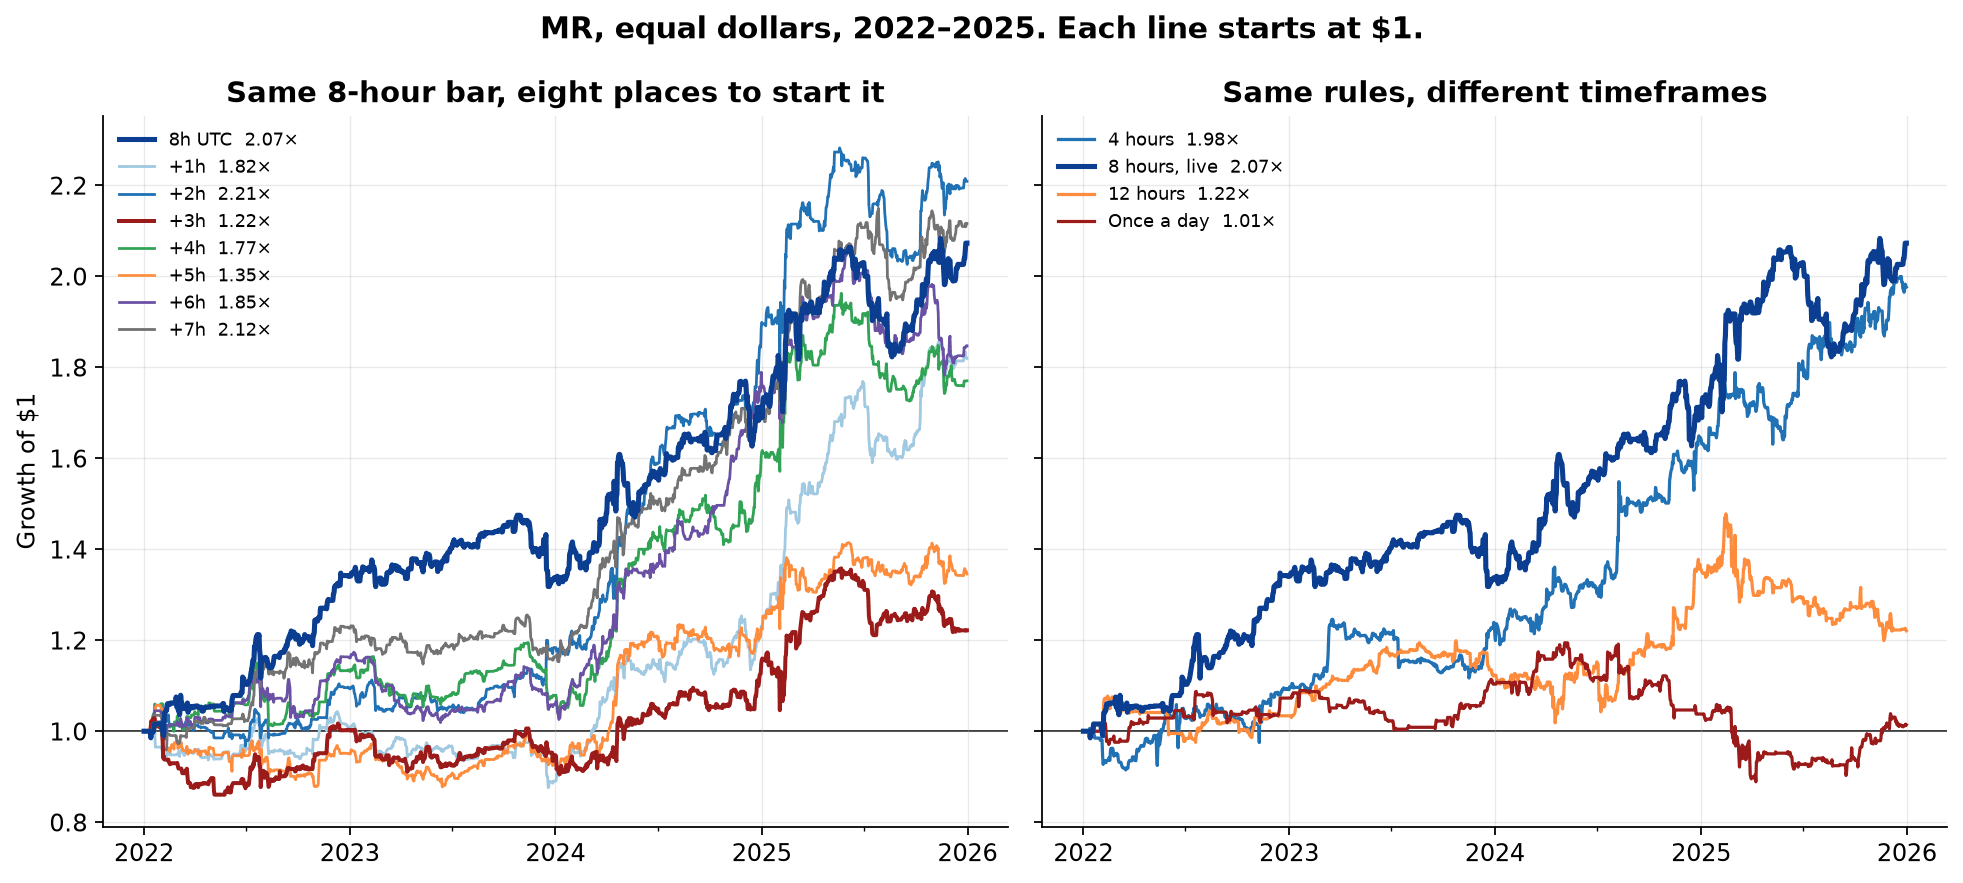
The left chart is the MR strategy on each of those eight clocks, equal dollars. The dark bar is 8h UTC, the clock the strategy trades. It is the strategy's own 8-hour result, about 2.07x. Every clock finishes above where $1 started. The clock three hours later finishes about 1.22x. The others finish between about 1.3x and 2.2x. The live clock is one of the stronger ones, and several of the shifted clocks finish in the same neighbourhood. A result that showed up on only one starting hour would be an unintended artifact of the session. What the chart shows is a group of clocks that finish up, with one weaker hour.
The right chart uses the same rules but applies them to different timeframes. The dark bar is the 8-hour bar the strategy trades. The 4h timeframe returns about 2x, the 12h timeframe 1.2x, and the daily timeframe 1.01x. This Mean Reversion strategy is a 8-hour implementation. Lower timeframes tend to be more favorable to Mean Reversion. Daily Mean Reversion is a different trade but can also work on lower timeframes. Often that is merely an implementation difference. We do also see that different years favor different timeframes. That is only a retro-spective insight however.
Below we can see both sides of the prior chart displayed as equity curves.
Live
From February 2026 the strategies have been running with the rules fixed, inside a hard market. A window this short can show that a smooth four-year line is kind. It cannot confirm a smooth score. The useful record is the path and the regimes we got. Mid-August is the break where we see the violent return of the momentum factor. The chart runs through mid-October.
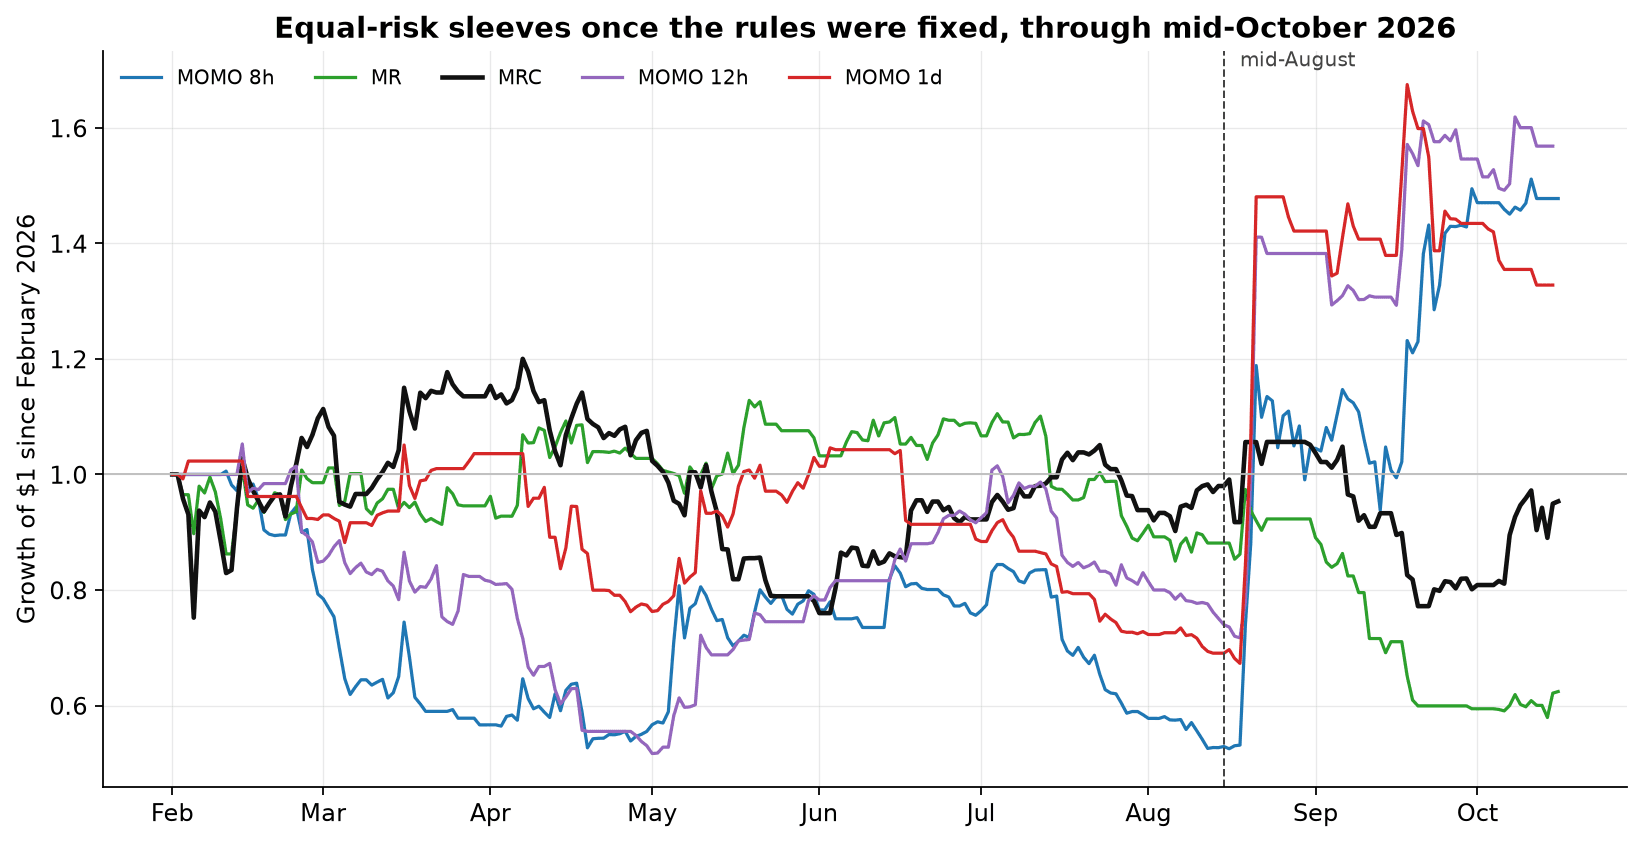
This chart shows the equal risk, sized curves, the way the strategies are run. Each column is the change during that stretch, from the level at its start.
| Strategy | 1 Feb-14 Aug | 15 Aug-23 Sep | 24 Sep-mid-Oct | Worst drop |
|---|---|---|---|---|
| MOMO 8h | -47% | +144% | +15% | -48% |
| MOMO 12h | -25% | +110% | ~0% | -51% |
| MOMO 1d | -31% | +101% | -4% | -36% |
| MR | -12% | -32% | +4% | -49% |
| MRC | -2% | -18% | +19% | -37% |
Through mid-August the momentum strategies were in a deep hole. MRC finished that stretch about where it started, after having been both up and down inside it. MR was down about 12%, a smaller DD than momentum. From mid-August through late September we saw the violent returns of the momentum factor, and both mean reversion strategies gave up ground.
That is the behaviour these strategies were kept for. Momentum suffers when the trend is broken and gets paid when the trend returns. The mean reversion strategies hold up better while the market is direction-less, and they are the ones that fail when the trend comes back in a rush.
We did see something similar in 2025, the year that was set aside at the time of strategy assembly and has since been read. On equal risk every strategy finished that year up, and every strategy except the 12-hour one had a drawdown inside the year of roughly 38-53%. In 2025 the returns of the individual approaches were clustered too. With momentum bringing the impulse returns together and struggling from roughly August onwards (before October 10th already), while Mean Reversion loosely struggled around the impulse periods but benefitted from the elevated volatility following October 10th.
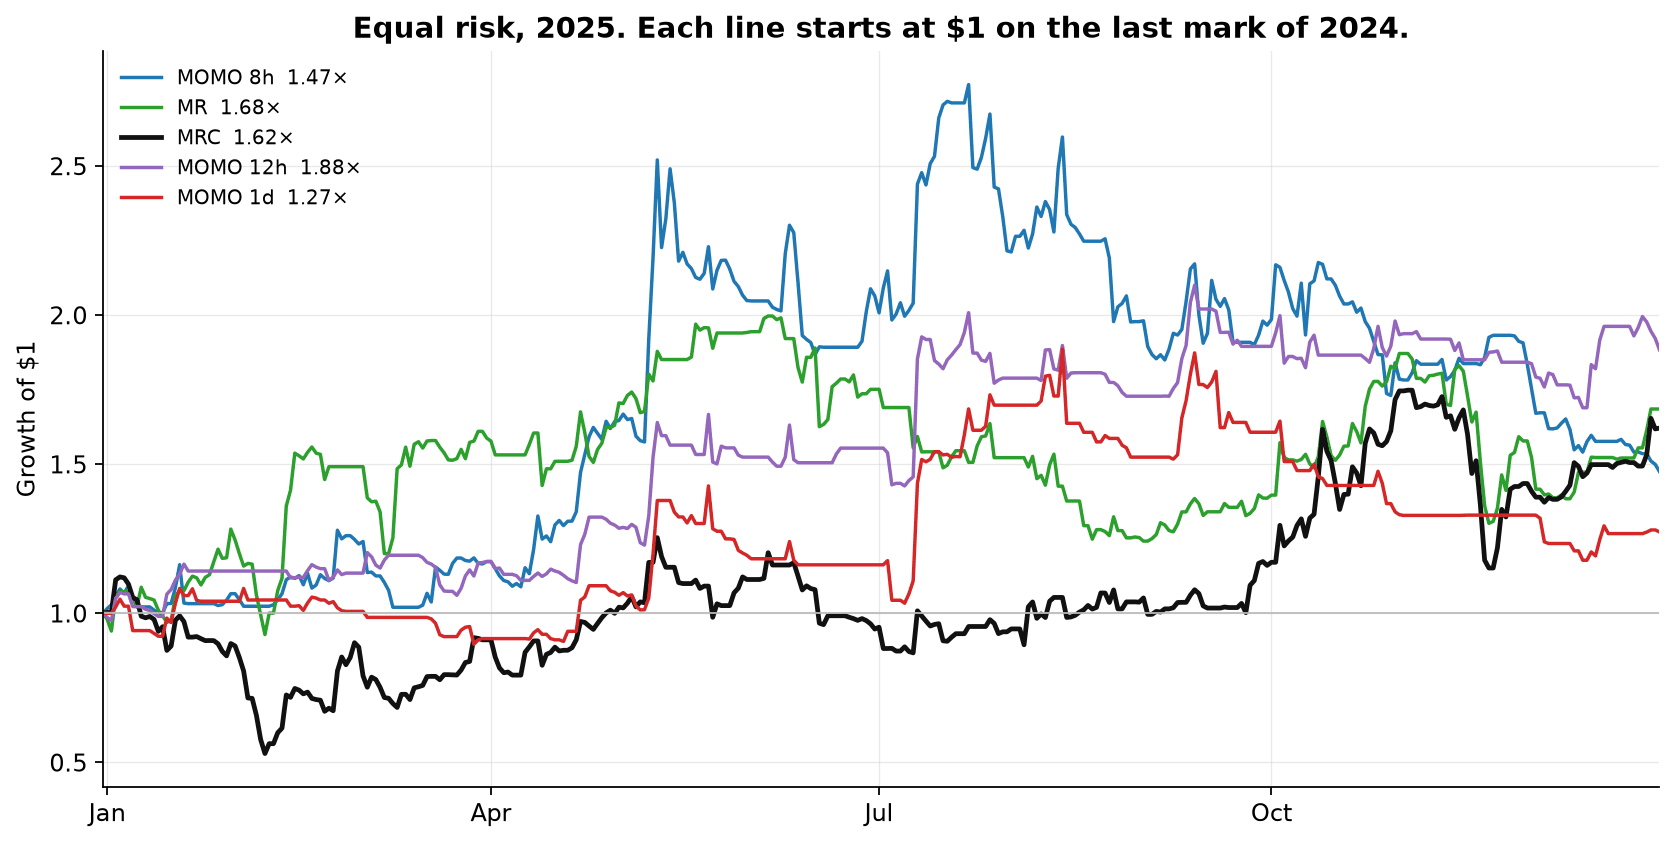
If we purely look at the equity curves however we are easily biased by the starting point because the initial "equity goes up/equity goes down" defines how we, as humans, mentally label the curves ("If it starts by going down it's bad. If it starts by going up it's good.").
That is why instead of looking at the equity curves, how about looking at the individual strategy drawdowns?
Drawdown from the high of that window, equal risk. The top panel is 2025. The bottom panel is the live book from February 2026. Trend Long and Trend Short are not on this chart.
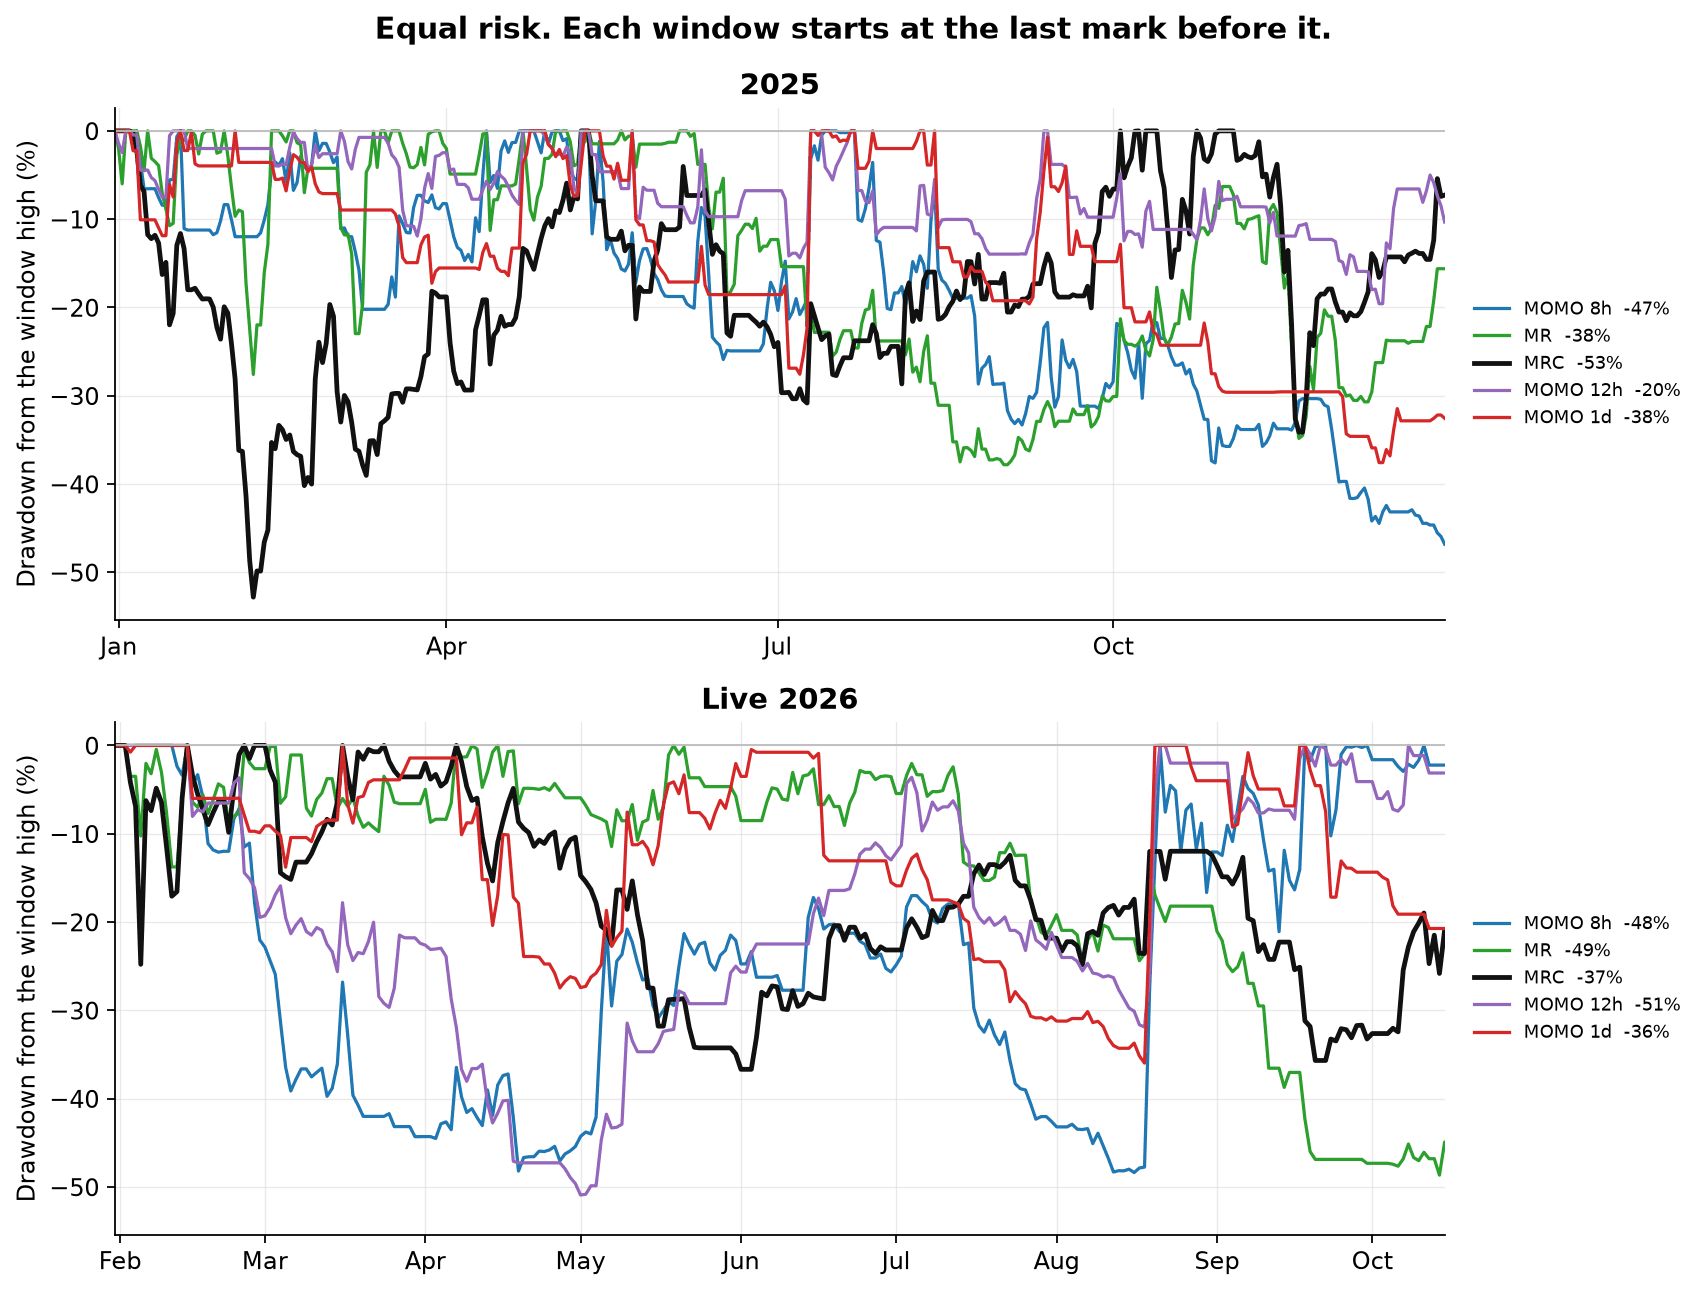
There are some nuances, including that the Live 2026 is short ~3 months to match a full year of data, yet in general the behavior is similar. What did differ in 2026, and we can effortlessly see that during mid-July to mid-August, is that the drawdown correlations were not as diverse and uncorrelated as in 2025. Instead in that July to August period we see everything drawing down together. There are - or can be - many reasons for that going from a simple understanding of uncorrelation to market regimes and volatility.
Uncorrelation - if longer term correlation is 0 that means that 50% of the time two strategies move together, 50% of the time they don't.
Statistically this can purely have been the side that moved together that we experienced. That is what something being uncorrelated means. If we wanted something that is negatively correlated, so that it always moves opposing to the rest, that would be closer to an insurance and means that it has a consistent cost that needs to be paid while the rest is going up, in order to harvest the protection when everything goes down.
Market Regimes and Volatility - a regime is a broad categorization of a behavior. One example can be a low volatility, choppy regime. All time-series implementations (e.g. they trade the price/asset directly - think of being long or short BTC) rely on price moves. When price doesn't move or doesn't move much then not much will be positively capturable. Mean Reversion acts on, or harvests, volatility (over-reactions). In low volatility, choppy regimes there is not much over-reaction to benefit from. Momentum requires breakouts that follow through, during low vol chop, breakouts can happen but they will not follow through. Yet we don't know on the time of the trade, because they will be wrong until... they are right and then we get a sudden mid-August momentum return.
The same rules on other universes
The live strategies use the ten-name majors list, or eight names for MR. For robustness sake we run the exact same rules on various other token lists below. A prettier line on one list is not a reason to switch. The question is whether the same behaviour shows up in neighbouring groups of coins while accounting for nuances of size effects.
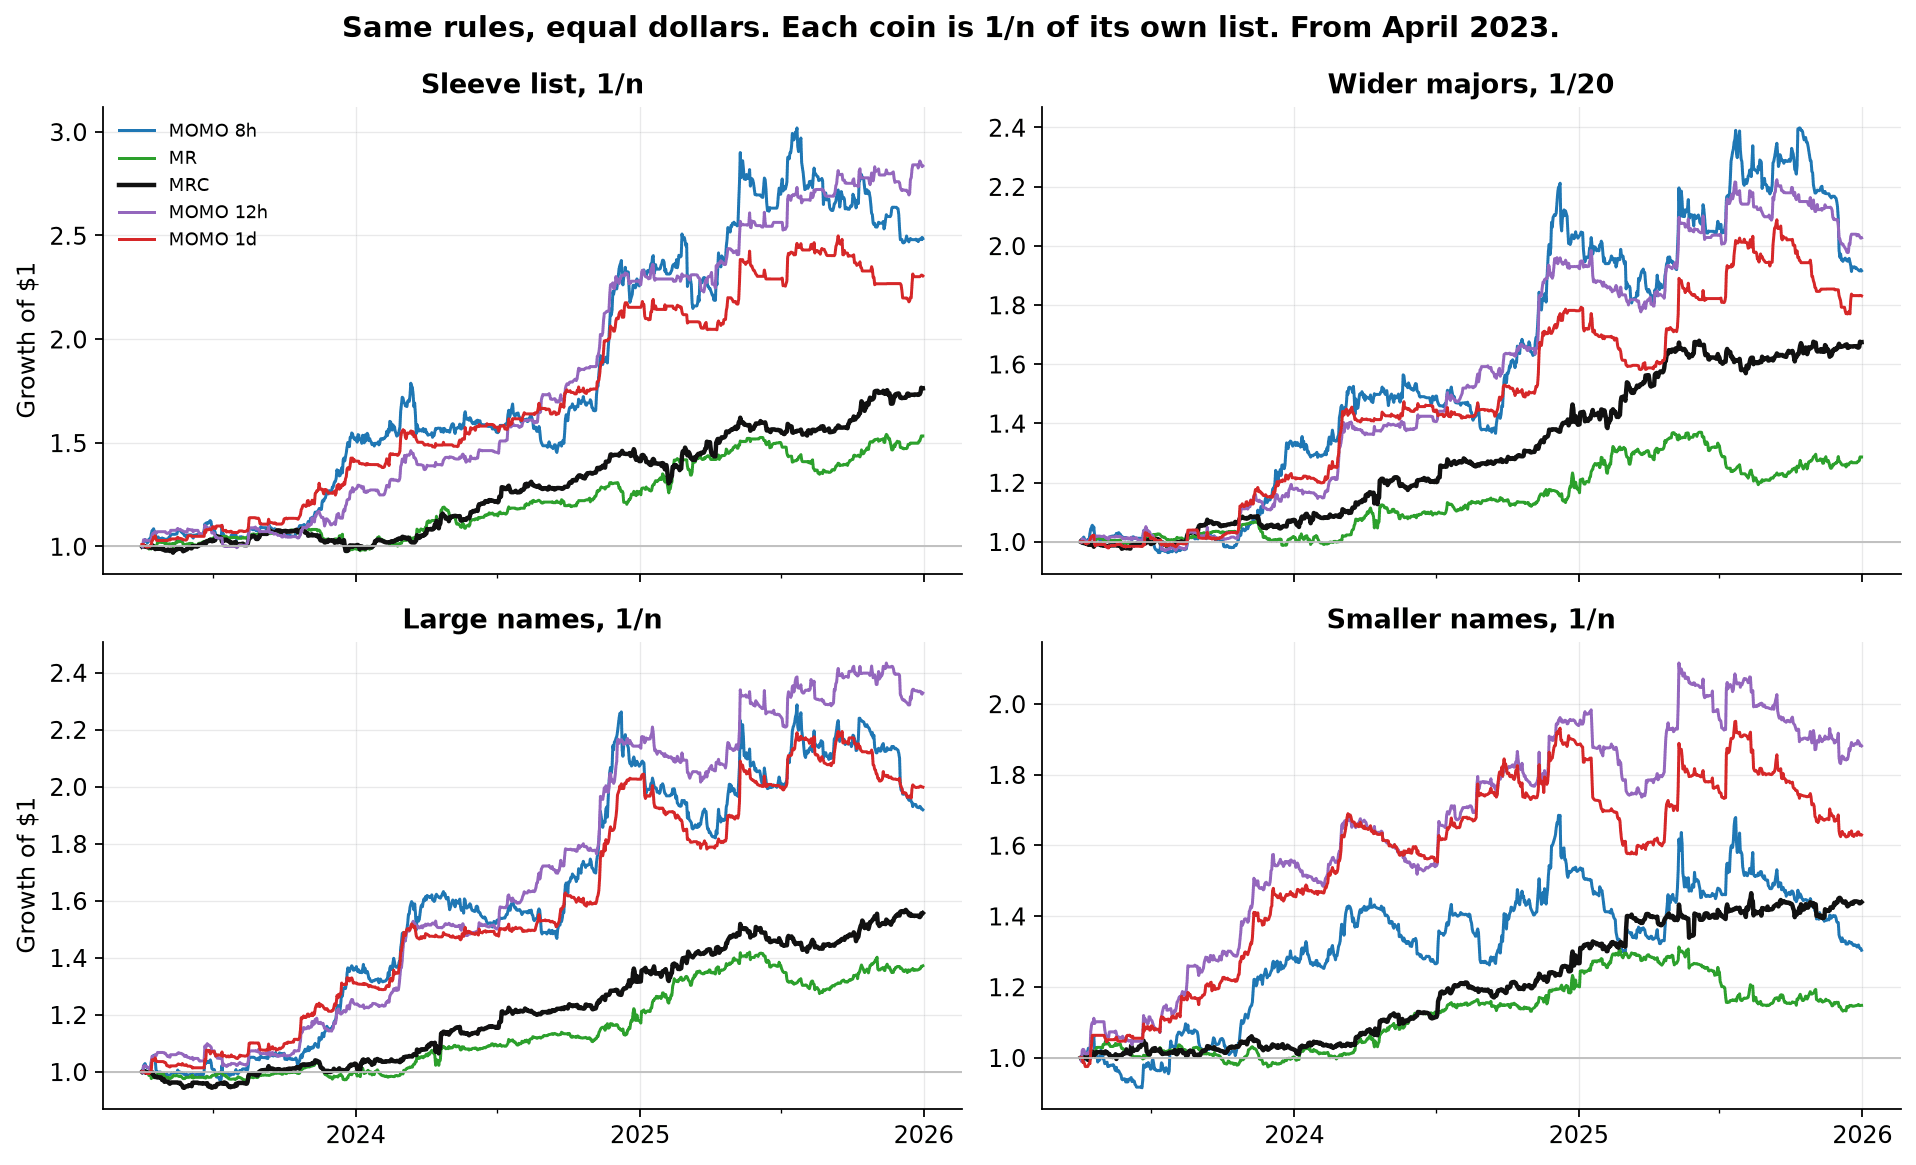
From April 2023, equal dollars, so the lists can be compared without a leverage argument. The large-name list and the smaller-name list only have a proper membership from early 2023, and they are thin in the first months, which is why the picture starts in April.
Wider majors. The same point-in-time idea as the live list, with 20 names instead of ten. A coin that is on gets one share of that quarter's list, so 1/20, where the ten-name strategy gives 1/10.
Large names. Simplified Hyperliquid tokens with allowed max leverage of 10x or greater. Membership from early 2023. Every strategy finishes up on equal dollars from April 2023 through 2025. The 12-hour continuation strategy is the strongest of the five on this list. The MR strategy is the quietest, and it still finishes up.
Smaller names. The lower-leverage names, a much wider and volatile list, again from early 2023. Equal dollars still finishes up for every strategy, by less, and the 8-hour momentum line gives back a lot of 2025. This list includes all HL perps with max leverage smaller or equal to 5x. So this becomes 90-130 tokens. And because this is a simplified equal dollar allocation, the tokens with higher volatility will add more risk to the strategy than those with smaller volatility. That is why the live book sizes for risk. Each coin is meant to carry a comparable risk.
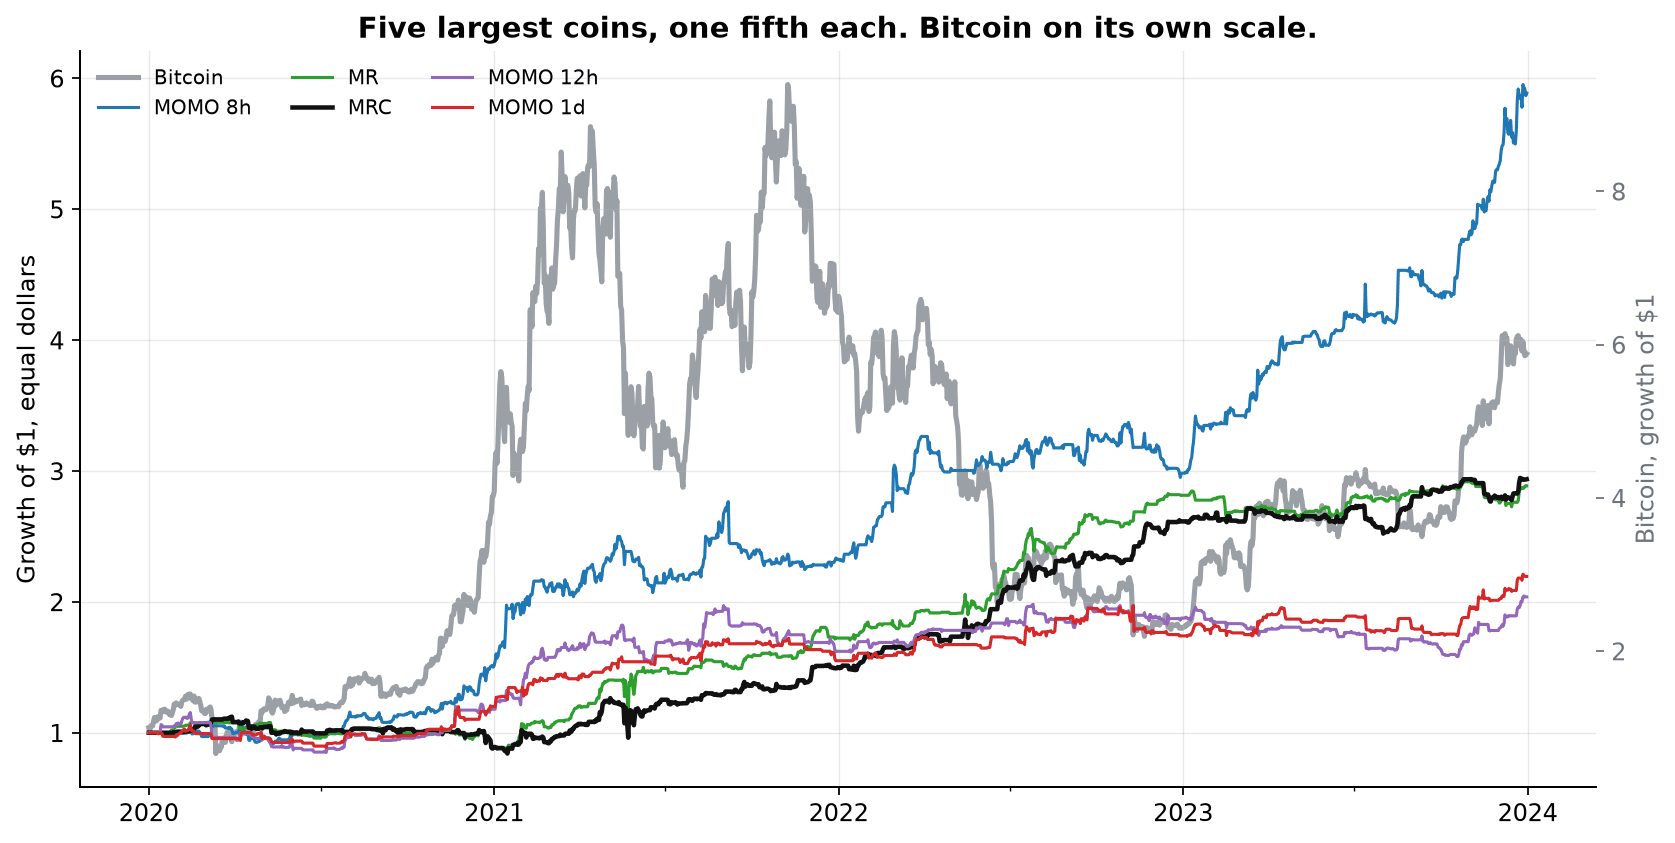
The five largest coins by market cap have a longer history, from 2020. Those five names have not changed since October 2023, so the list is still the current one. The chart stops in late 2023 anyway. Putting 2024-2026 on the same picture would squash the 2020-2022 path, which is the part this example is for. The grey line is Bitcoin over the same dates but on a separate scale, growth of $1, so a reader can see which stretch was the 2021 rise, the 2022 decline, and the 2023 recovery. Displayed here is the equal-dollar, unsized version.
What about other price sources and funding
The charts above are perpetual contracts, the instrument the book trades. The same rules were run again on spot prices for the same names, and only in the quarters that name is on the list. Hyperliquid spot is used where we have it. Binance spot fills the earlier history.
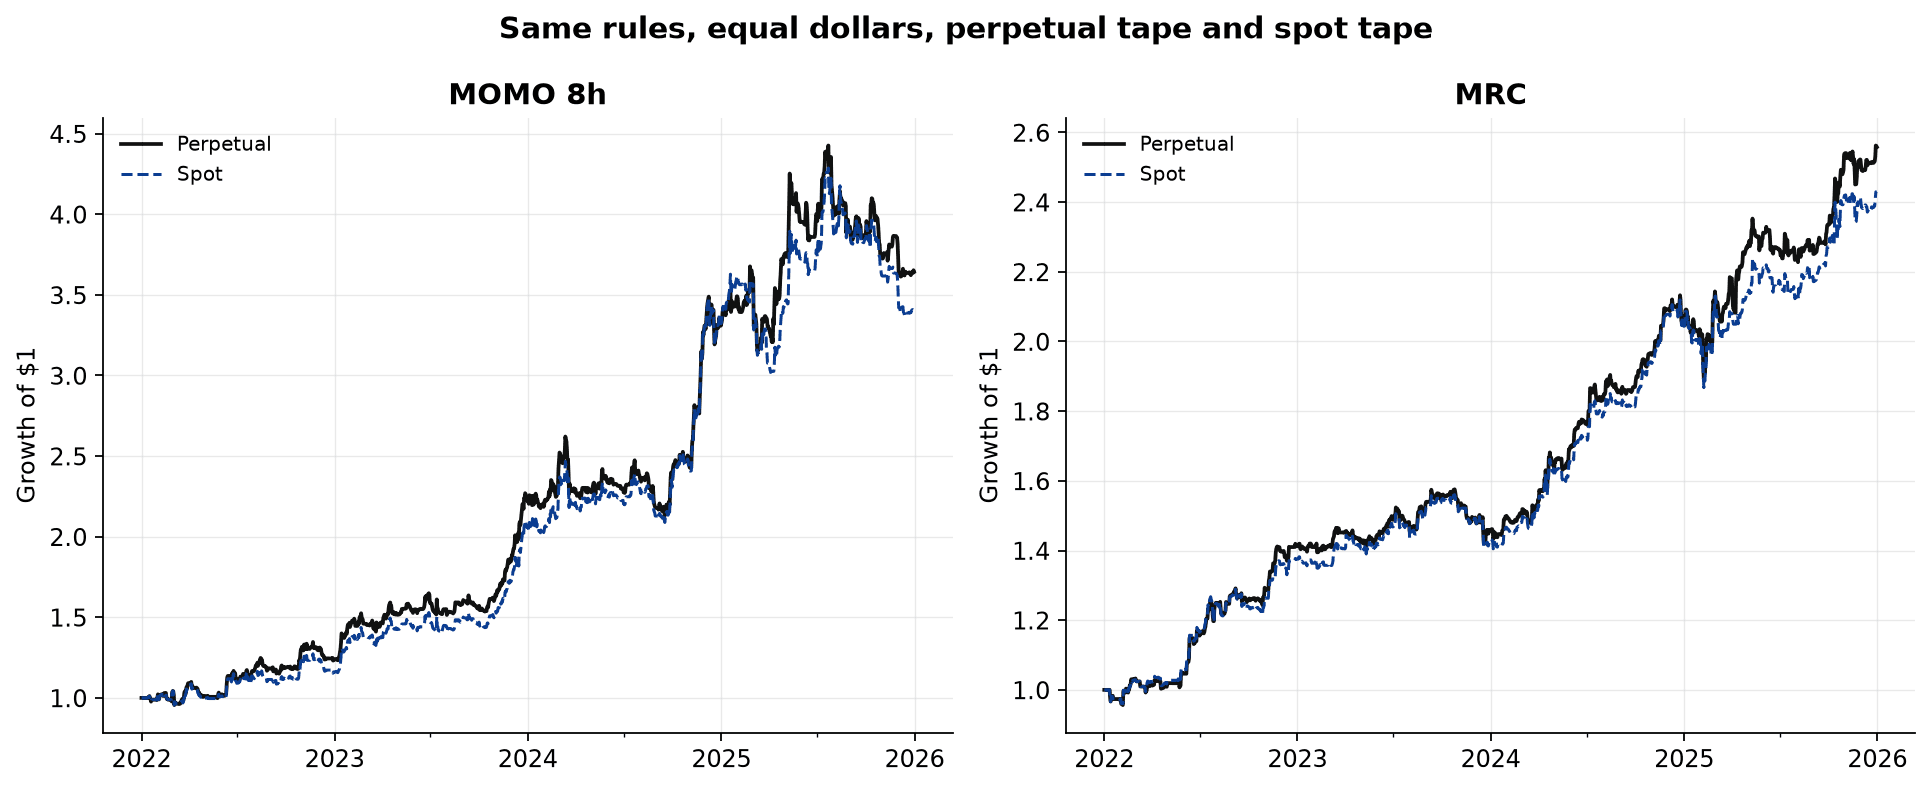
On equal dollars over 2022-2025 the two tapes finish close.
| Strategy | Perpetual | Spot |
|---|---|---|
| MOMO 8h | 3.6x | 3.4x |
| MR | 2.1x | 2.0x |
| MRC | 2.6x | 2.4x |
| MOMO 12h | 4.1x | 4.0x |
| MOMO 1d | 2.9x | 2.7x |
The MR and 12-hour momentum finish close on either tape. The other three keep the shape and finish a little lower on spot.
Funding is the rate perpetual holders pay each other. The paths in this note charge the trading fee and the slippage allowance. Now we apply funding:
| Strategy | Perpetual | Perp+Funding |
|---|---|---|
| MOMO 8h | 3.6x | 3.1x |
| MR | 2.1x | 2.1x |
| MRC | 2.6x | 2.5x |
| MOMO 12h | 4.1x | 3.7x |
| MOMO 1d | 2.9x | 2.7x |
Momentum spends more time in the market, so it also pays a higher funding cost. Mean Reversion spends little time in the market and often opposes the directional consensus, so the funding impact is small.
A score we use only as a gauge
Sharpe ratio is annualised return divided by annualised volatility. It is a convenient gauge of how choppy a path was.
There are two versions worth giving attention to (assuming risk free rate of 0). One divides the average return by volatility (arithmetic, classic literature). The other divides the compounded growth by volatility (geometric, often preferred). The compounded version is the one that matches the path a client actually experienced. On these strategies the two sit near each other. Both have a wide margin of error, wider still because successive days are related (autocorrelation) and because the coins are one market. We are not "owed" a certain Sharpe by the market. Neither can we guarantee any Sharpe. The best we can do is report what has happened and what is happening. A sharpe ratio is also not a claim, proof, or result we are trying to keep. Measuring sharpe ratio also has a high standard error. The only reliable way to affirm a certain sharpe is by looking at years or decades (depending on trade frequency) of live data.
Still, Sharpe Ratios are a useful analytical tool. "All models are wrong, some are useful". This also holds true during construction. Choosing purely the highest sharpe is ignorant of the underlying logic and intention of the components/strategies or systems.
What this supports
The object worth believing is that a stack of ordinary rules, each aimed to capture a specific behavior or path, run as one strategy, in a market where the tokens move together, can provide reasonable results. Some rules show a larger move while they are in a trade than while they are not. Some show it only in the average, because a tail carries them. No Strategy is a single "high Sharpe", overfit rule that works in all conditions. Rather each strategy is made up of multiple components consistent with the over-arching strategy type/idea.
| Strategy | There to get paid when | Soft, or outright ugly, when |
|---|---|---|
| MOMO 8h | The market is continuing: reclaims and breakouts | Low volatility; Chop |
| MR | A one-day bounce after an overreaction | Periods of Momentum or prolonged low volatility periods |
| MRC | Downside over-reactions and continued downside momentum | Also suffers in strong upward momentum, but can handle short side momentum a bit better. Weak during low volatility |
| MOMO 12h | Ordinary breakout with lower trade frequency | Chop |
| MOMO 1d | Daily breakouts, in the right tail more than in the typical day | Chop |
Nothing in that table is a promise that a past multiple will repeat. Momentum and mean reversion, sized, will draw down by about 50% in the regimes that hurt them. The months since the rules were fixed have already been one of those regimes. The quantity we try to keep alive is the strategy's payoff when its own market arrives, after funding, after a realistic cost, and after a drawdown the account is sized to survive because the strategy is only one part of it.
Software and engineering services. Not financial, tax, or investment advice.