

Directives
Jan 9, 2026
System: Breakout Capture System
New subsystem for SOVEREIGN
by CelestialEye | Quantitative Systems Engineer
Understanding Momentum in Trading
Momentum comes in many different shapes and forms.
Generally, momentum will look something like the below:
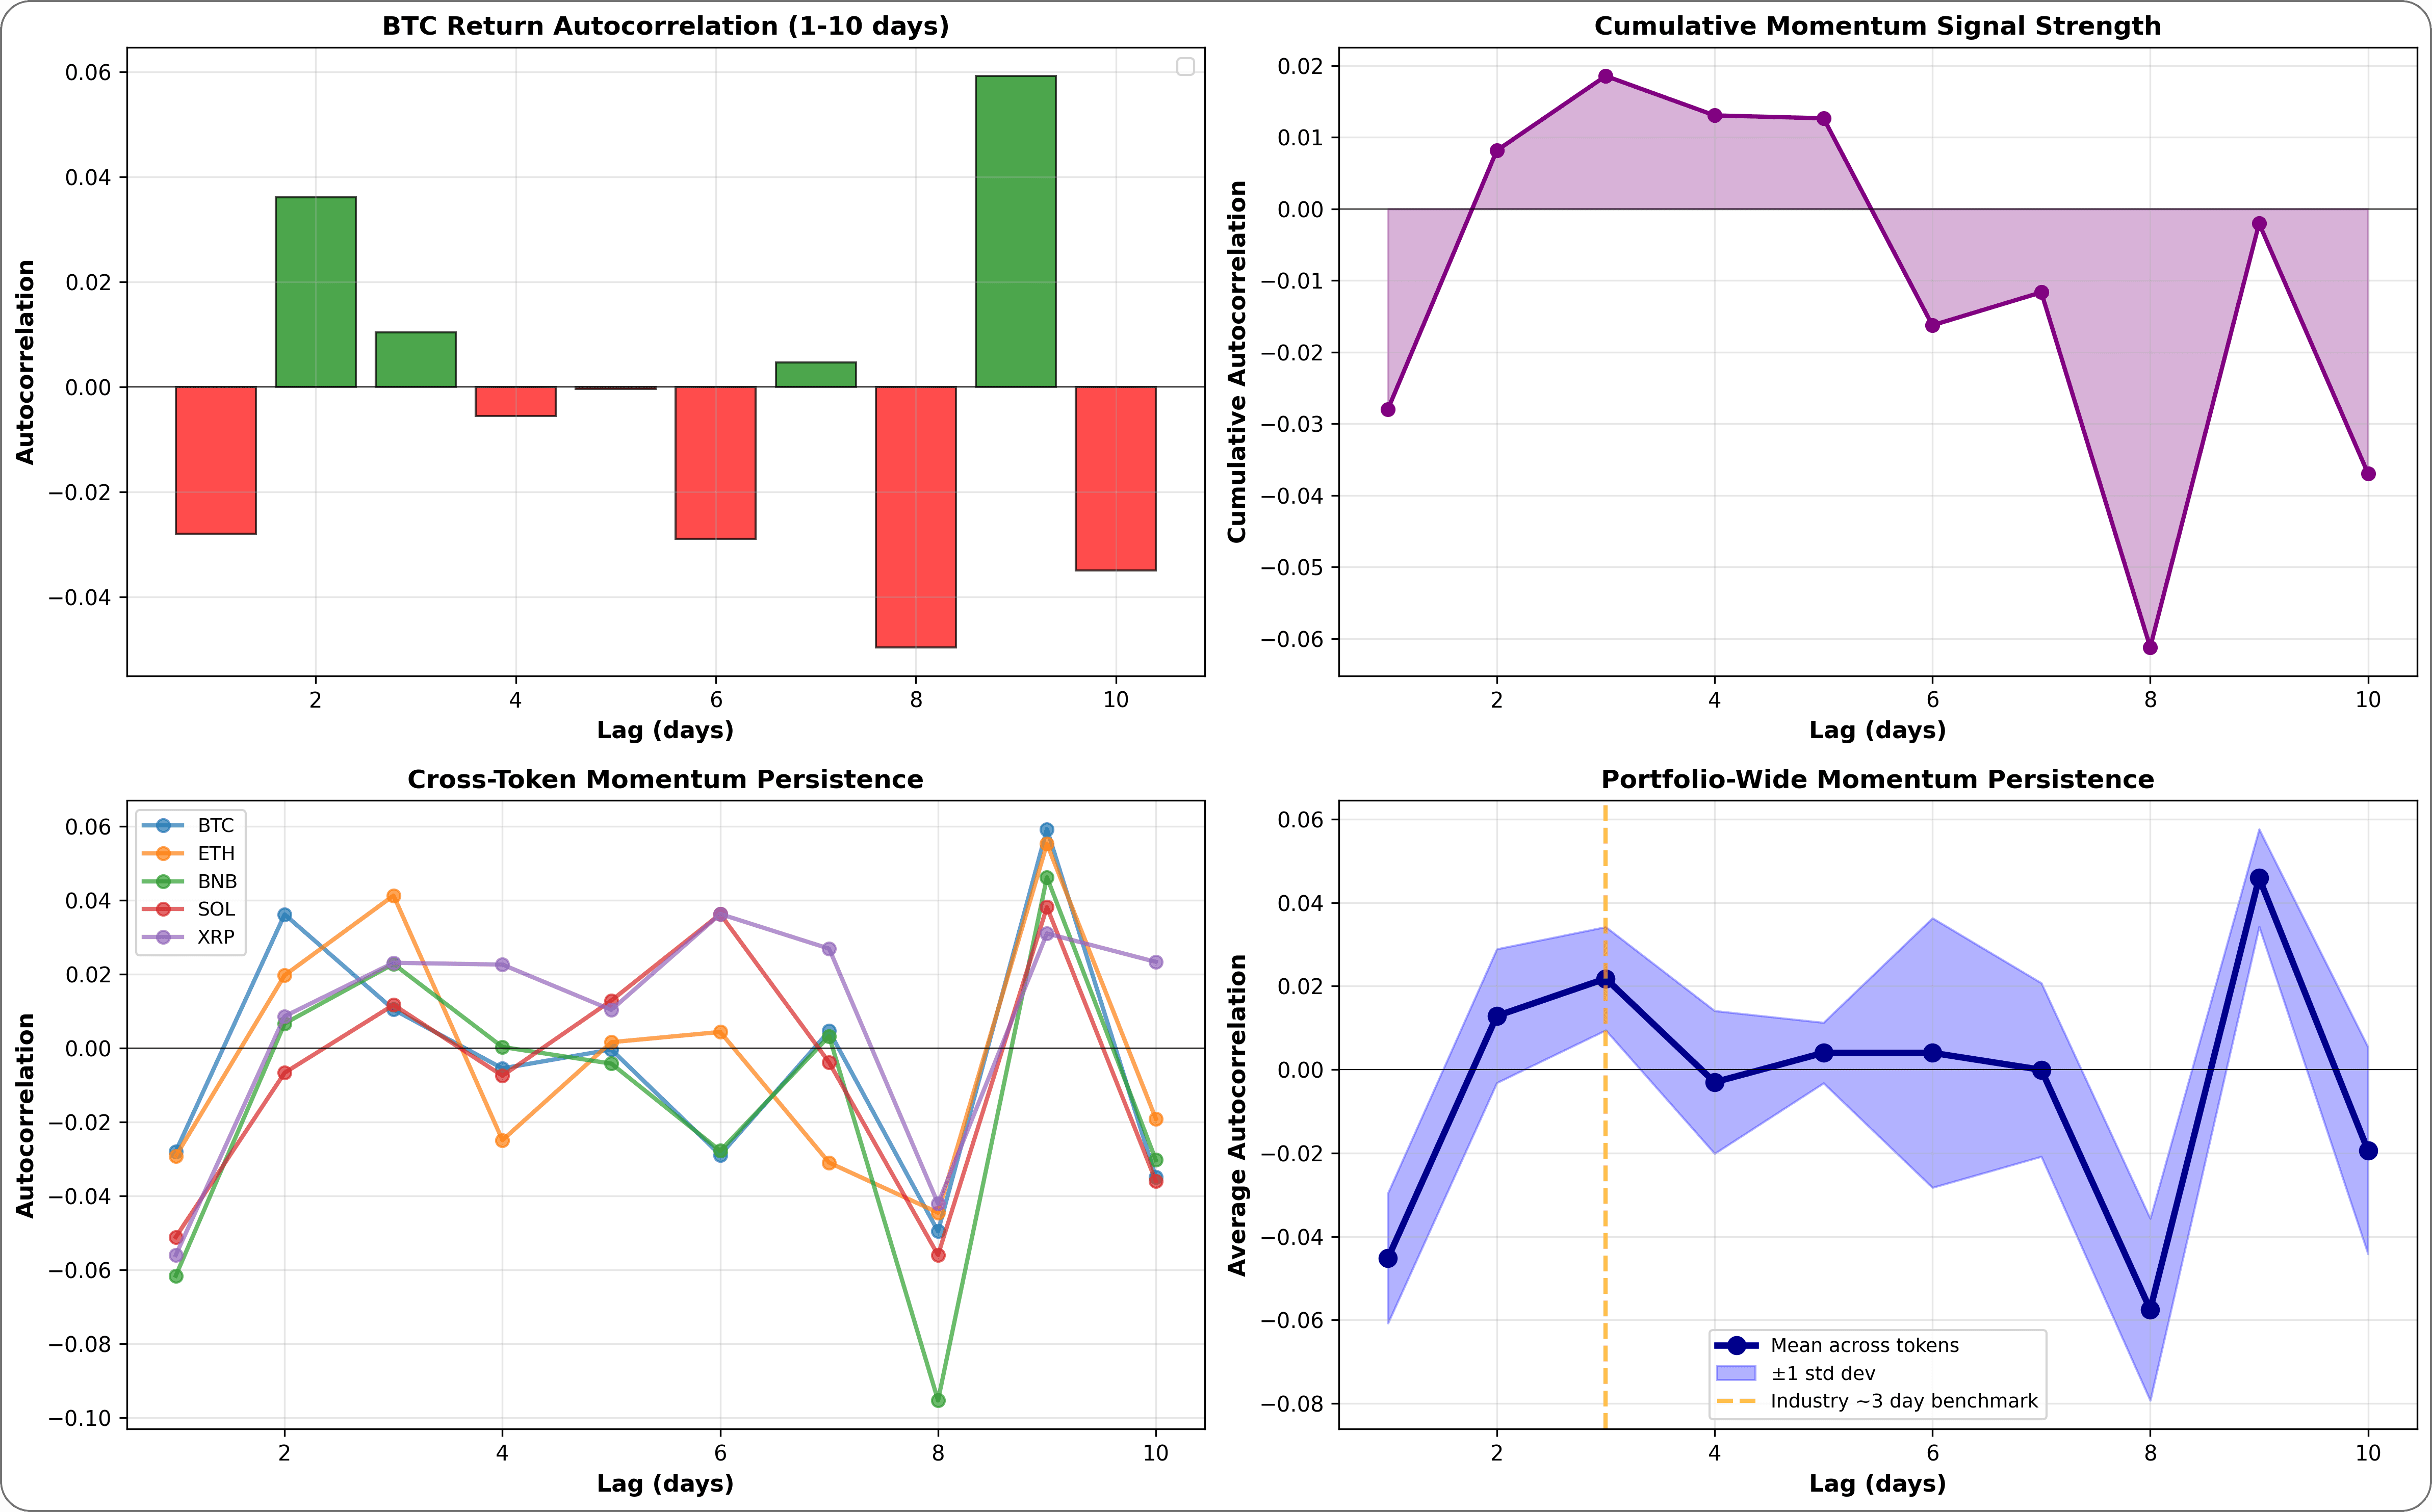
Most noteworthy is the high return autocorrelation on the first couple of days.
This is the most “standard” approach to momentum.
It basically comes down to this: if we have a persisting momentum signal, then we assume that the price will continue to showcase that momentum behavior for a while longer.
TradFi vs. Crypto Momentum Lookbacks
In TradFi, there are typical models looking at multi-month momentum like 12-1, 6 months, or 3 months.
Funnily enough, some of these things only work because everyone is doing it (looking at 12-1 here ^^) - there were some very interesting signal seasonality studies done on that, which showed that outside of the typical momentum signal lengths, there is no autocorrelation - i.e., inverse signal or noise if using random lookbacks.
This does not mean that they don’t perform well; they are just not explainable in the exact same manner - but I digress.
In Crypto, we don’t need/want multi-month lookbacks.
Instead, simple models would be looking at 2, 3, or 5-day momentum.
General momentum persistence we found to last up to 3 days after a momentum signal. This is coherent with Crypto Industry standards for momentum behavior.
The Simple Bollinger Band Breakout System
However, just because the momentum effect lasts for up to 3 days, it doesn’t mean that we necessarily want to be exposed to that for the whole time.
A simple visual example can be found below. What this shows is a basic Bollinger Band (20, 2), where the upper SD band is shown. If we say that the price is “breaking out” of the BB, then we could define this as an example of momentum.
It quickly becomes visible that this type of momentum is really rather short-lived.
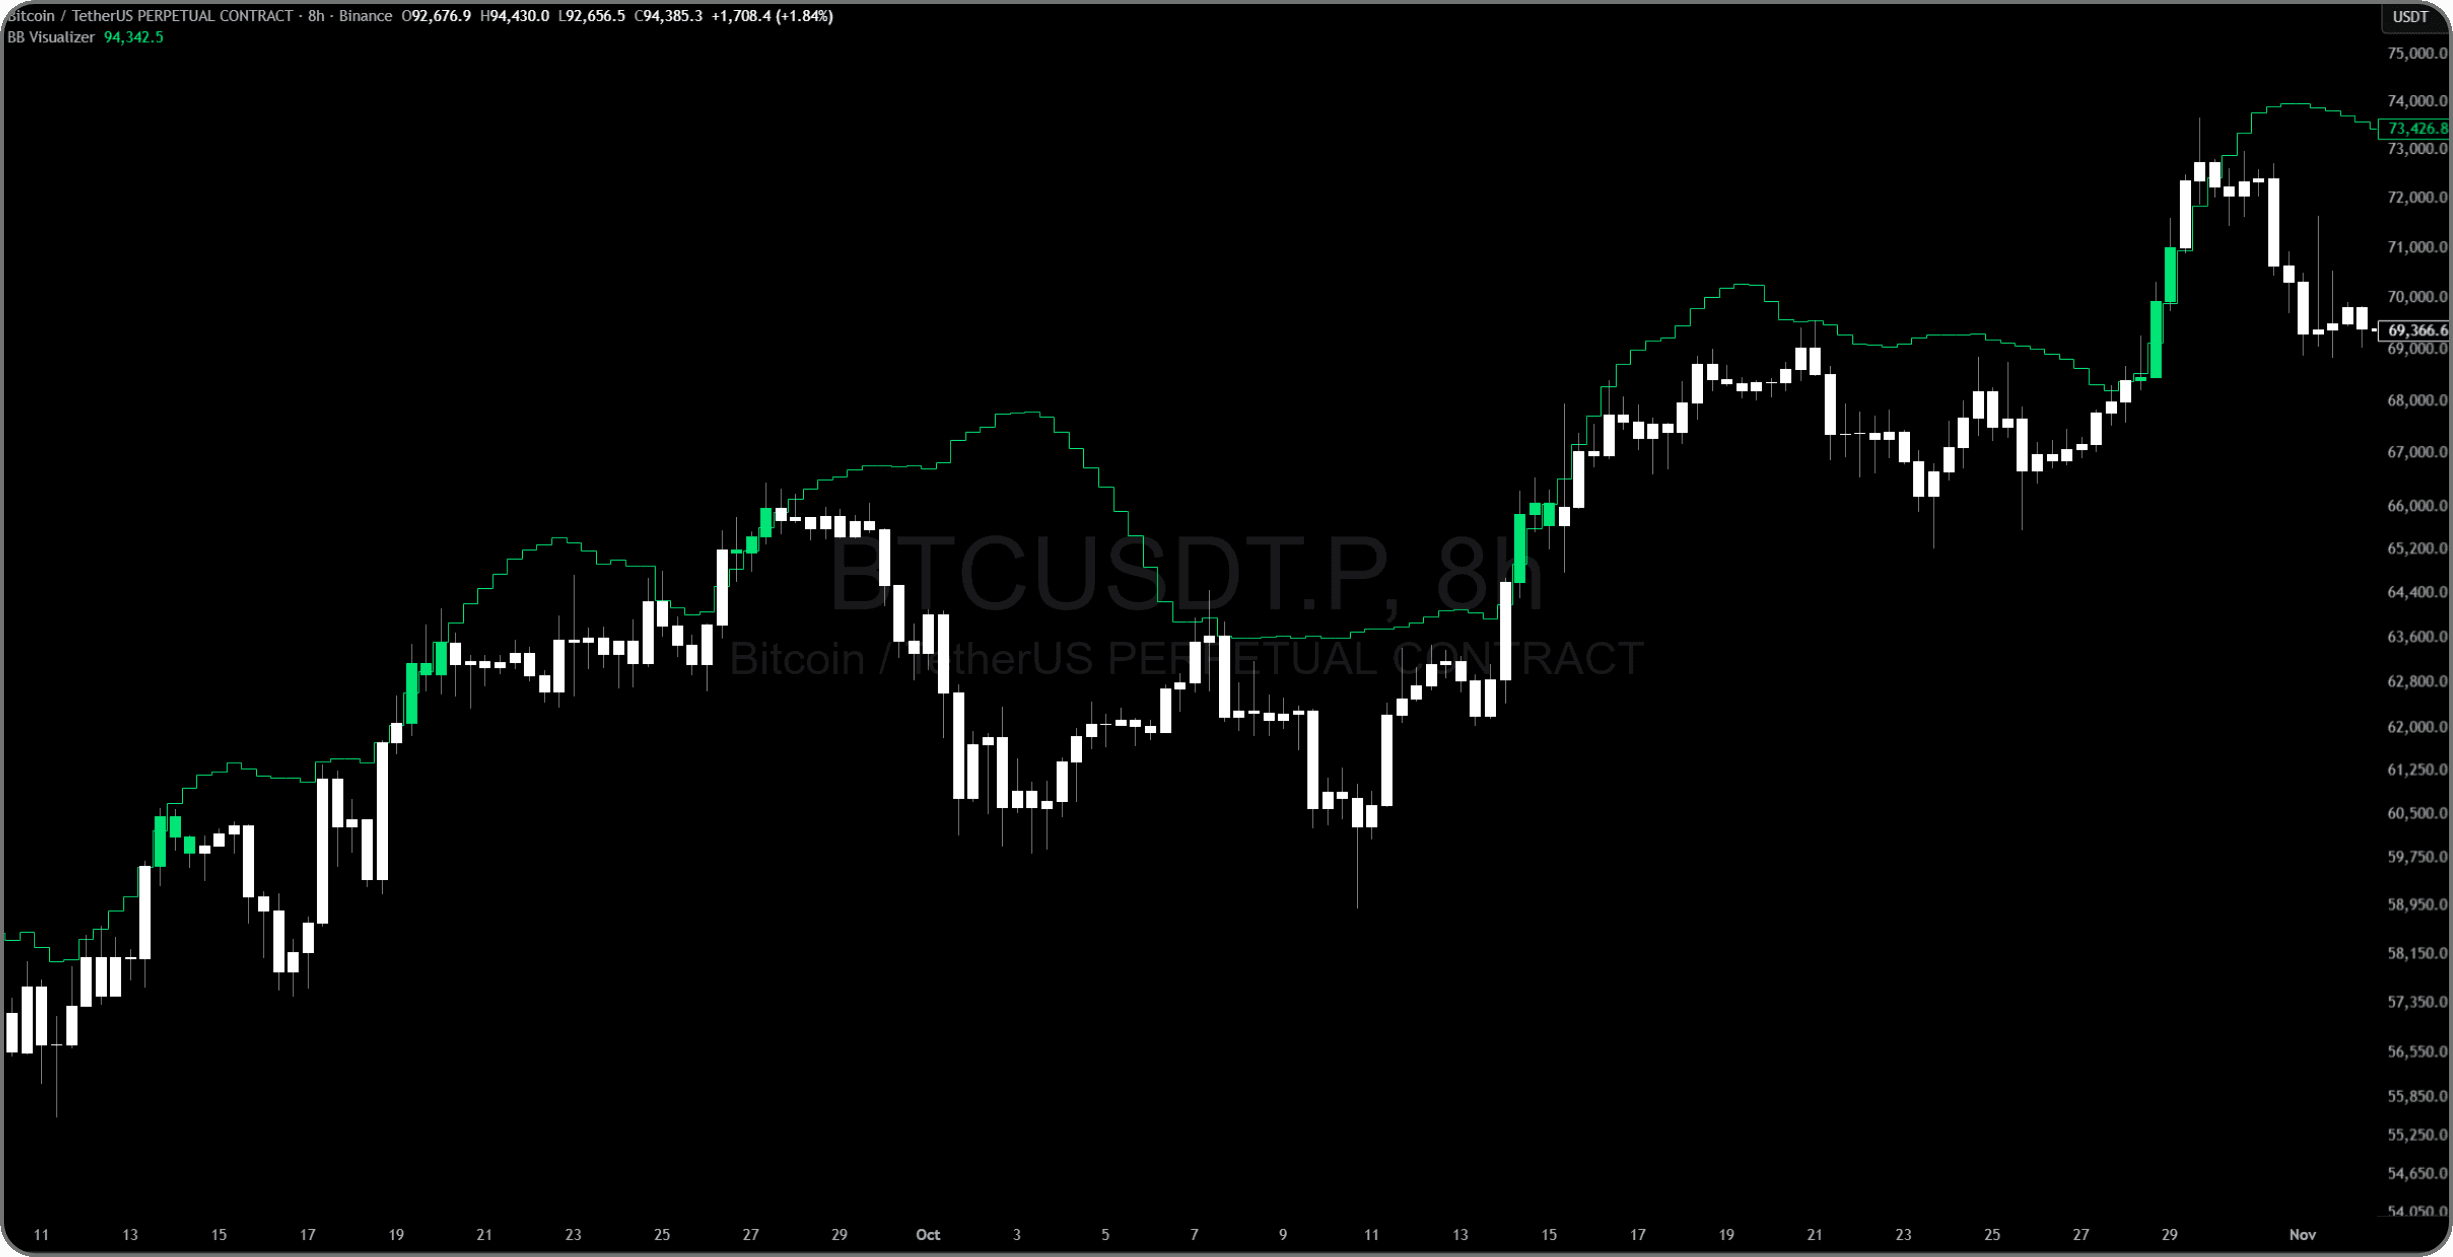
Therefore, we visualized here with lime bar-coloring the holding period of 3 bars (8h chart) → 1 day.
With this, we capture the bulk of the "break out," but with a much lower risk of price moving against us and, therefore, lower volatility.
Meaning a higher certainty of capturing exactly the momentum we want with reduced tail-end volatility.
For that, we can find that the above implementation on its own is already okay in the sense that it captures momentum and is profitable as a standalone system.
But it is both rather capital inefficient and highly regime dependent.
Enhancing the System: Volatility and Directional Filtering
To make it more useful within the portfolio, we want to do some basic filtering—mainly volatility and direction—so that we don't take long trades when the trend is down, as these "breakouts" on a negative trend tend to revert faster and more aggressively. The same directional filter applies to short trades.
This above observation that "breakouts" revert more aggressively on opposing trends is something we'll also utilize, though.
Then, filter out low volatility periods to reduce trades with low continuation likelihood or just those that are hardly worth being traded.
To this, we can add the short side of similar logic, just that we specifically look at low volatility periods here instead of filtering them out.
This way, we get a more stable and consistent system behavior, trading both sides and only when the environment is favorable for the system methodology.
Addressing Inefficiency: Integrating a Mean Reversion Element
What this leaves us with are still capital inefficient periods where the system itself is not being allocated due to the filtered-out vol periods or just because there is no breakout happening.
Meaning, if we want to get the most out of this, then we can add either a different momentum element or a mean reversion element that is only active during the time when the current momentum system is not active.
To remain in the style of breakouts, cover the weak point of the pure momentum system, and utilize the behavior of breakouts reverting aggressively when the market/asset trends into the opposing direction, the second partition used in this system is a mean reversion system that essentially jumps in when breakouts fail.
System Partitions in Detail
Partition 1: Bollinger Band Momentum
Multiple Long & Short versions:
For the Long side, we look at periods of higher or normal volatility, while the short side only trades during low volatility.
Then, any breakout or breakdown outside of BB is traded assuming continuity. There are different parameter specifications at play to capture different specifications/periods.
MOMOL1 (pink) and MOMOL2 (cyan) are long; MOMOS (orange) is short:
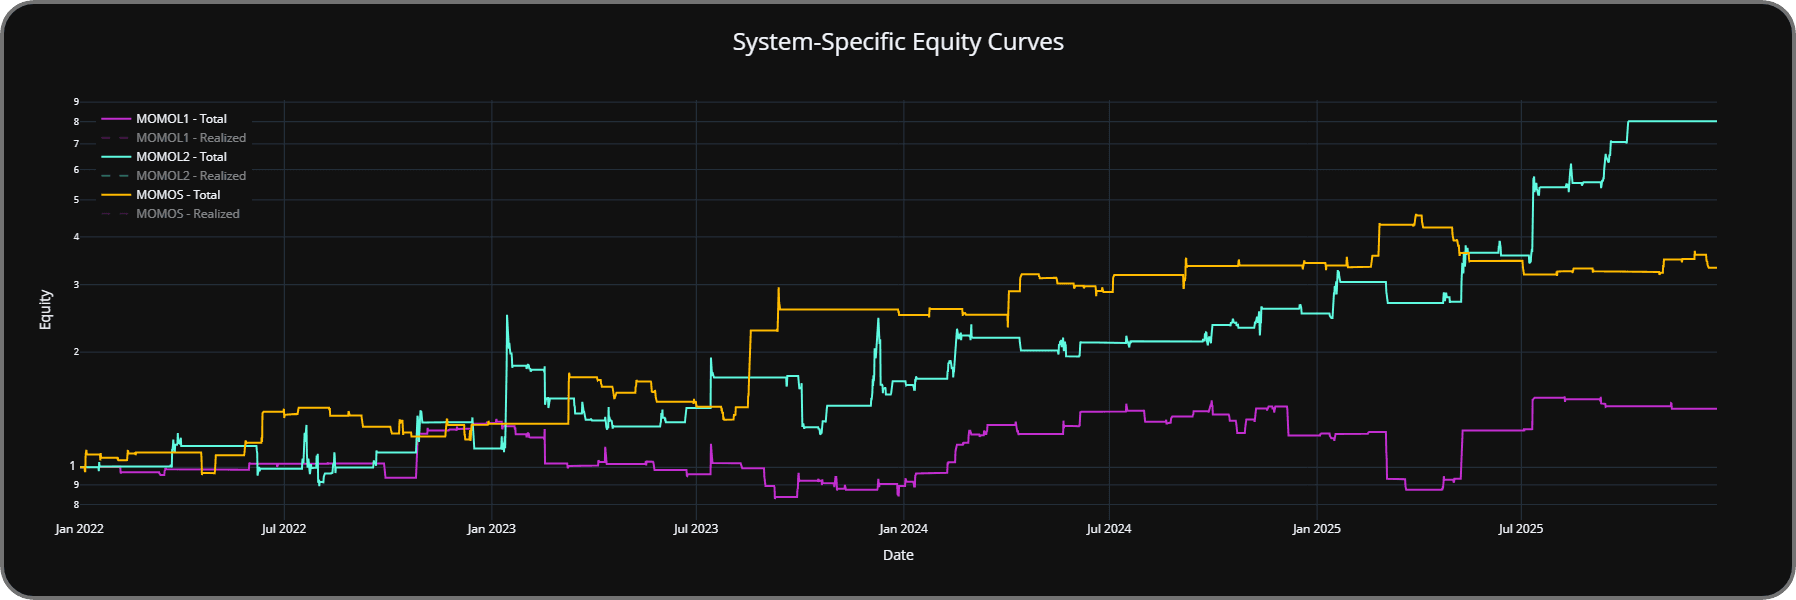
Correlation of both long components is ~0.6.
They are not completely different from each other, but there still remains a benefit of diversifying between the two of them.
Partition 2: Breakout Rejections (Mean Reversion)
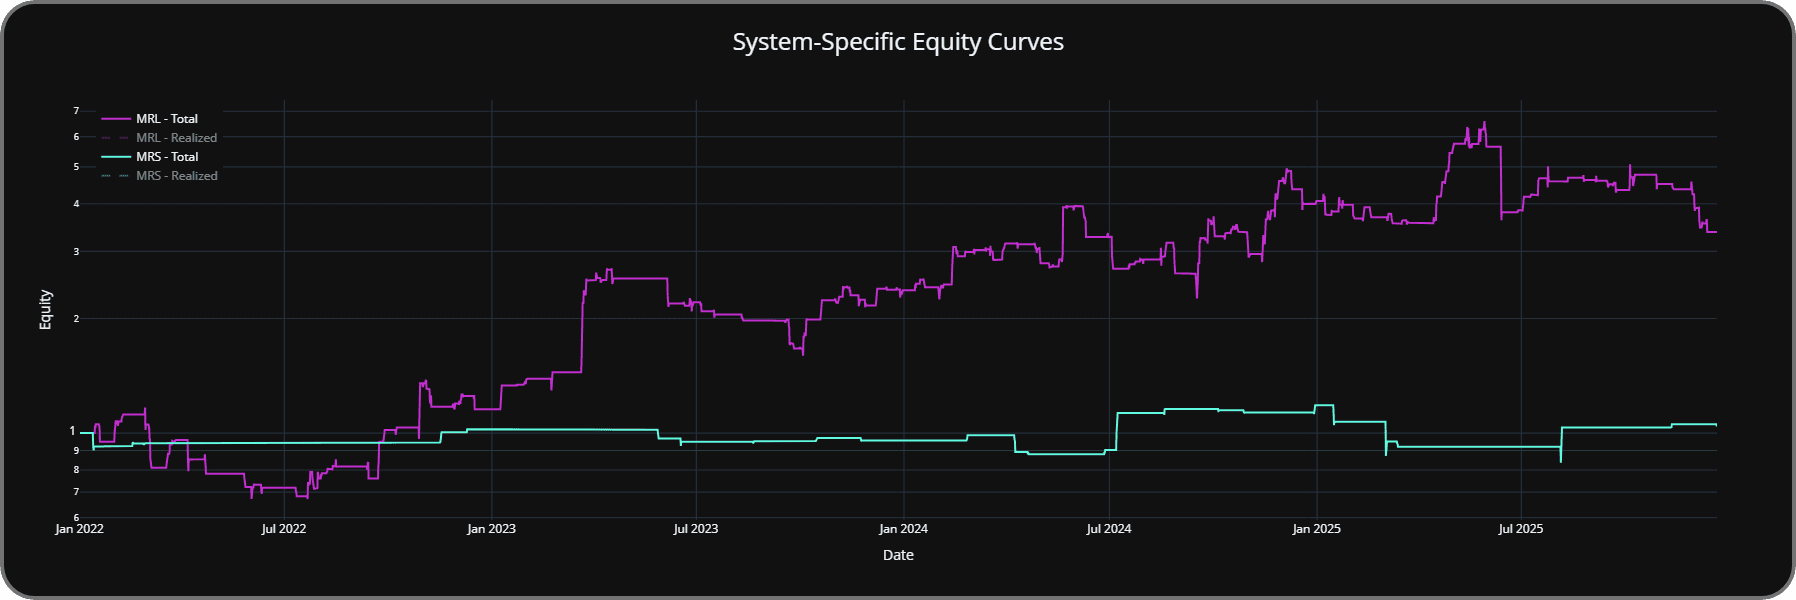
Long & Short: Price closes x continuous bars higher than open + price closes higher than previous x period closes and asset trend is down -> take short.
Inverse the logic for longs.
Goal is to capture failing breakout attempts. Pink is MR Long; Cyan is MR Short.
Conclusion: Benefits of the Combined Portfolio
And now, putting the "partitions" together:
Pink is Momentum; Orange is Mean Reversion; Cyan is the combined system.
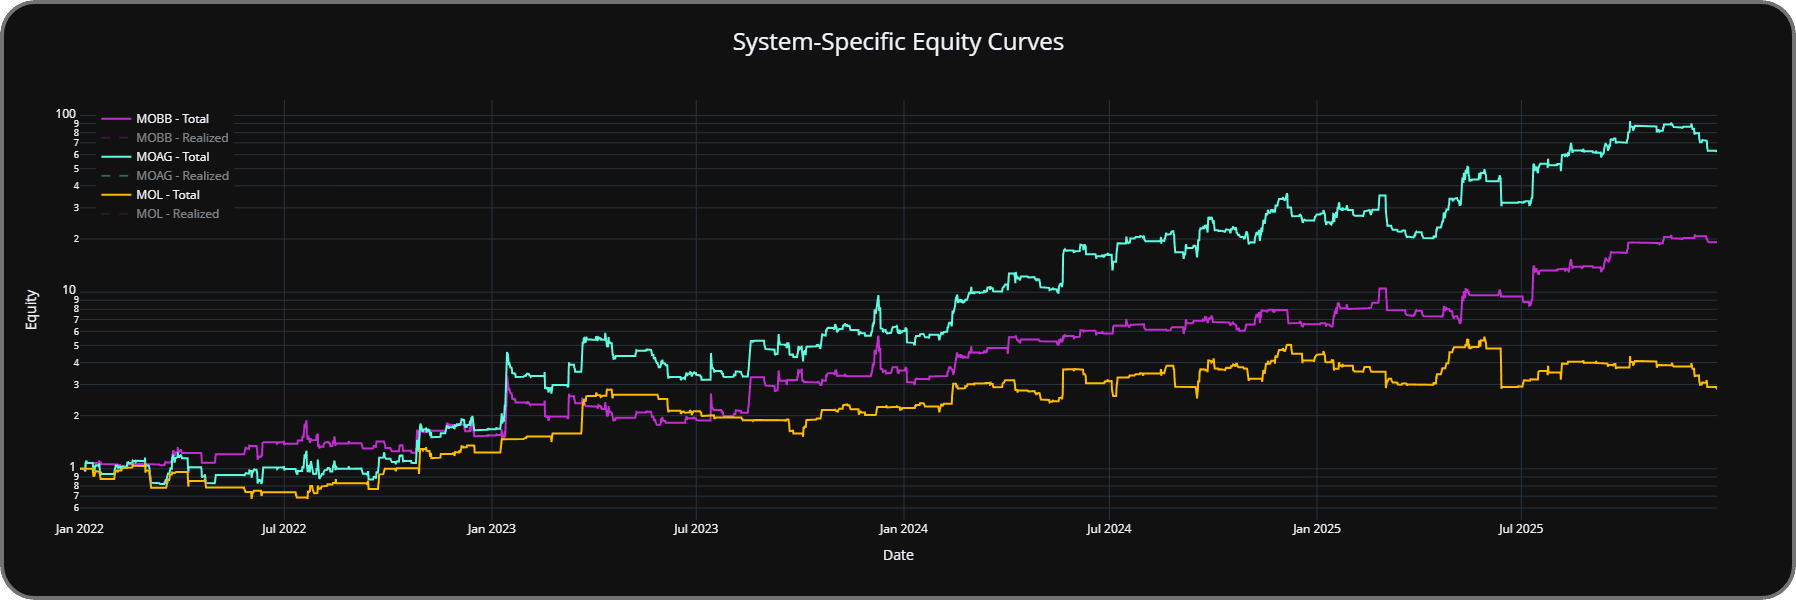
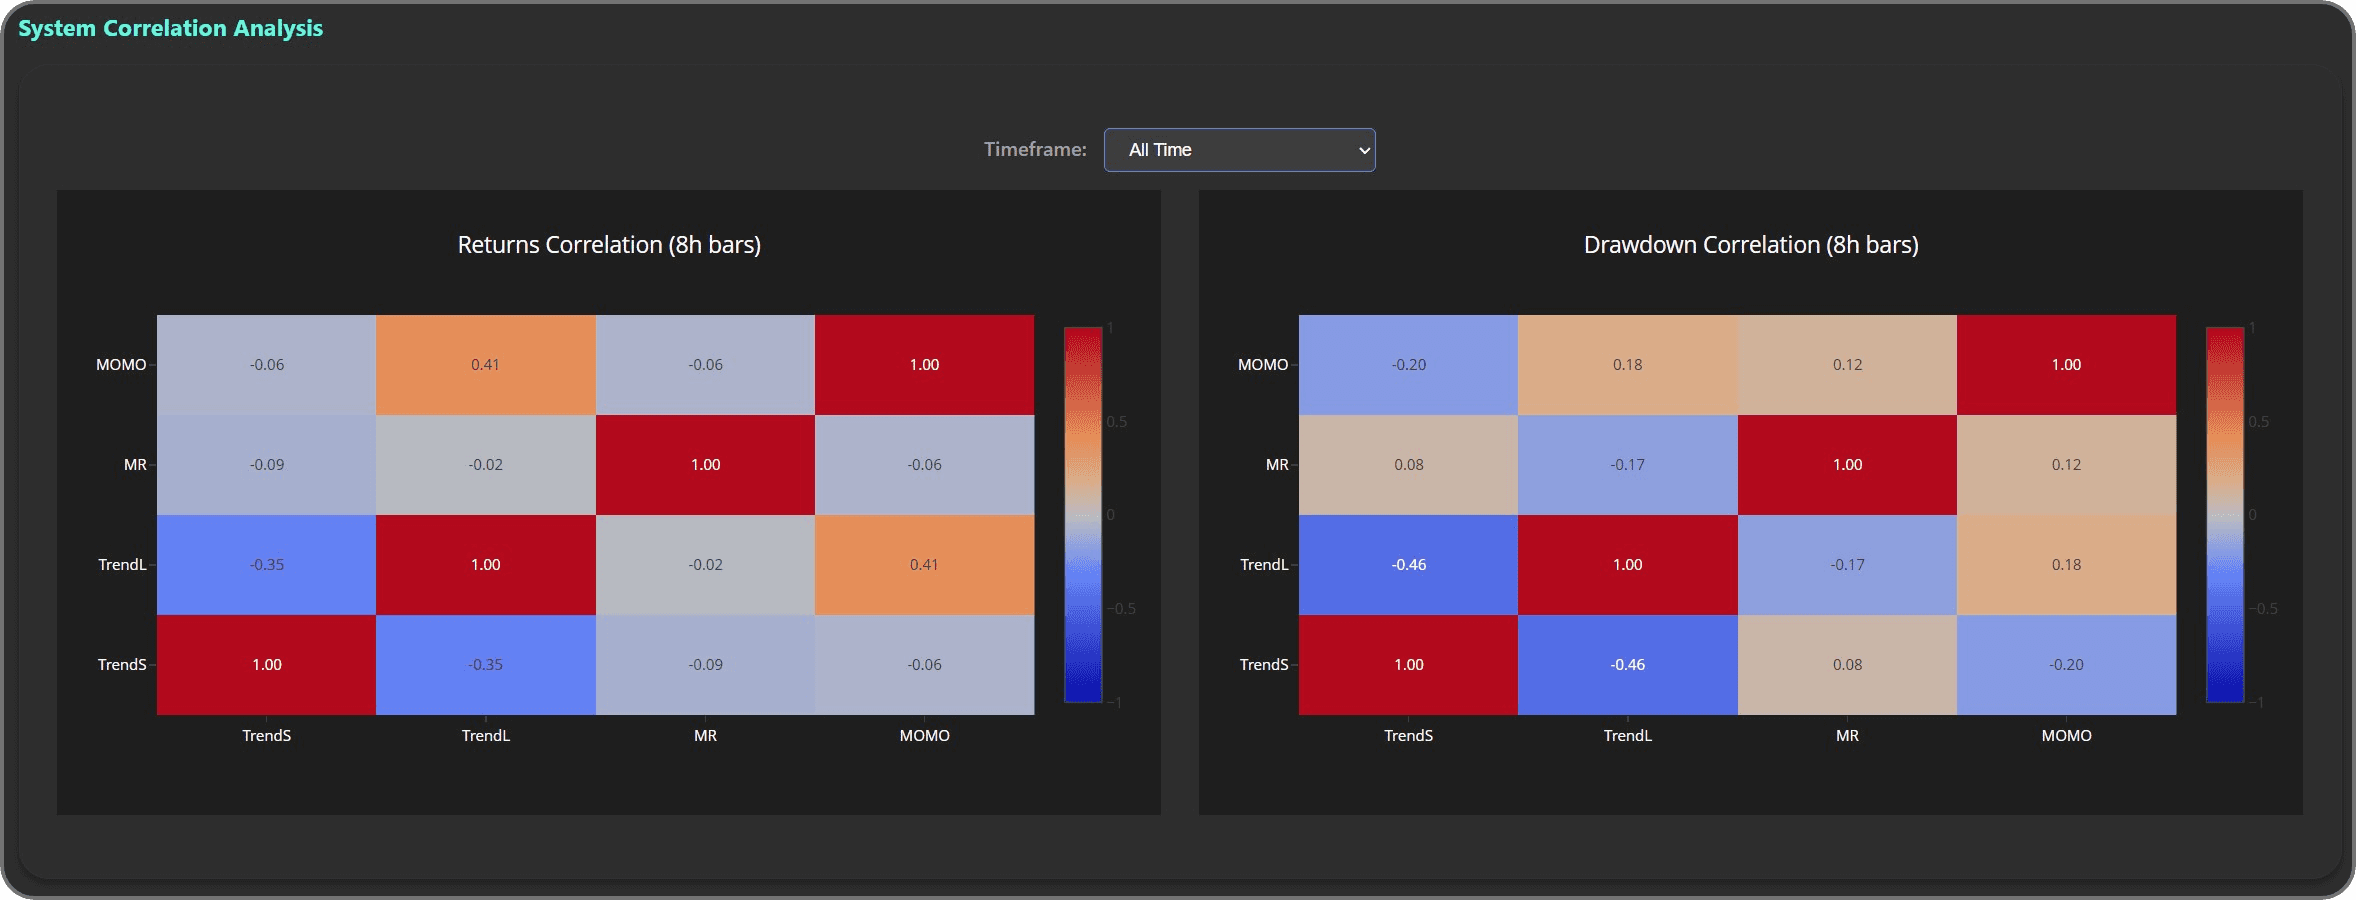
When adding this to the existing Trend Long, Trend Short, and Mean Reversion systems, we can find that both the drawdown periods and the return periods are nicely uncorrelated, which allows the combined portfolio to increase win rate and returns and decrease drawdowns.
Overview